Trading with price action - Crypto Academy / S6W2- Homework Post for @reminiscence01


Price action is the price movement of a security that is plotted over time on a chart. Price action forms the basis for all technical chart analysis of stocks, commodities or other assets. Many traders use short timeframes but rely on extrapolated patterns, trends and price action when making trading decisions. Technical analysis, as a practice, is derived from price behavior because it uses past prices in calculations that can then be used to make trading decisions.
Price action can be viewed and interpreted using charts that show price over time. Traders use a variety of chart compositions to improve their ability to identify and interpret trends, breakouts, and reversals. Many traders use candlestick charts because they help to better visualize price movements by displaying open, high, low and close values in the context of an up or down session.
Candlestick patterns such as the Harami cross, the engulfing pattern, and the three white armies are examples of price action that can be interpreted visually. There are more candlesticks generated by the price action to create anticipation for what is to come. The same construction can be applied to other chart types, including scatter and figure charts, box plots, box plots, and so on.
In addition to visual formations on charts, many technical analysts use Price Action data when calculating technical indicators. The goal is to find orders in price movements that sometimes seem random. For example, the ascending triangle pattern, which is formed by applying a trend line to a price action chart, can be used to predict a potential breakout as price action indicates that the bulls have tried to break through several times and are gaining momentum each time.
This is important because in using the Price Action trading strategy, look at historical price action data and try to determine which direction the market will move next. Price Action is a unique approach that brings profits to millions of traders around the world.
Analysis of this information is the basis of price action trading is to study the actions of all buyers and sellers who are active in the market. Therefore, analyzing the activity of market participants gives traders a unique advantage in making trading decisions.
When you look at the price chart, all the emotions and beliefs of traders around the world are reflected there, on the price chart, in every candlestick that forms at any given time. If you see a lot of red candles and only a few green candles at any given time, it means only one thing: there are many traders in the market who have a strong selling belief and the cumulative result of that belief is a downtrend and a downtrend. price action reflects that belief at the moment.
The Main Findings in price action include the following:
Price action sometimes refers to the up and down movement of prices in the market over time.
Different views can be applied to the chart to make the price action trend clearer to traders.
Forms of technical analysis and chart patterns are based on price action. Technical analysis tools such as moving averages are calculated based on price movements and are predicted into the future to inform trades.
With Price Action analysis, you will benefit because you will be able to determine what is most likely to happen next - whether the market will go up or down.
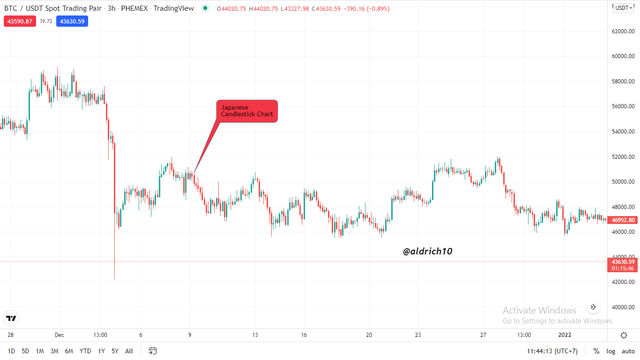
The most commonly used price action is the price bar. The most popular price bars used as price action indicators are Japanese candlesticks. All trading platforms in the world provide candlestick charts, which prove once again how popular price action trading is.
As noted above, the most commonly used price action is Japanese candlesticks, as they provide detailed information about the market's opening and closing prices and levels of high and low prices over a certain period of time.
Let's look at an example:
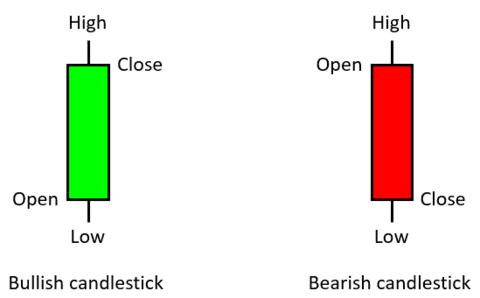
On the daily chart (Daily period), each candlestick will represent trading information for the whole day. The two candles above provide useful information as follows:
High and low price levels tell us the highest and lowest prices reached in a trading day.
A seller's candle, with a black or sometimes red body, indicates that the sellers have won the trading day battle. This is due to the fact that the closing price level is lower than the opening price level.
A buyer's candle, with a white or sometimes green body, tells us that the buyers have won the trading day battle.
Using candlesticks is one of the steps to create a Price Action strategy. As an example:
If, after a seller's candle, the next candle makes a new low, this indicates that the sellers are ready to continue selling in the market. This will force some traders to start selling (i.e. selling positions) or continue to hold short positions if they are already short.
If the next candle reaches a new high after the buyer's candle, this indicates that the buyers are ready to continue buying the instrument in the market. As a result, some traders will either go long (i.e. buy positions) or continue to hold long positions that they have previously opened.
This type of analysis is just one way to use candlesticks as an indicator of price action. However, the candle itself often forms a pattern (number) that can be used to create a Price Action trading strategy. Before we look at these patterns, let's first understand where they work best.
- Do I prefer other chart patterns?
No, I think Japanese candlestick charts are ideal, the most important information is highlighted in bold, but there is a place for less important, but still needed information about price movements within a certain price range. Japanese candlesticks contain all the same time intervals as the current Timeframe. For example, if the current Time Frame is H1 (1 hour), then each candle will store information about price movements for one hour.
Candlestick charts, like bars, allow traders to use candlestick patterns and patterns formed on price charts. In addition, candlestick charts allow you to most accurately determine entry points. A chart consisting of bars can boast of the same.
Multi-timeframe analysis is tracking the same trading pair on different timeframes each of which has a different information value. Simply put, each timeframe provides traders with unique information that other timeframes don't have.
The simplest and easiest to use is that I will use 2 main time frames with 2 different purposes:
Large timeframes are used to establish long-term trends.
Smaller timeframes are used to determine entry points.
Multi-timeframe analysis is always the first choice and also the optimal choice for traders. Perhaps most traders ignore the main trend, miss obvious support and resistance levels, and ignore trend reversal points. And locked in one time frame from there missed out on some good opportunities.
Others felt that multi-timeframe analysis was too complex and sometimes contradictory, causing them to abandon this method. Or just lazy or forgetful. Traders tend to look at charts and see good signals, and they will enter trades immediately and not analyze them closely.
We can mention the following positive features of this technique:
Using multiple trading periods in trading allows you to quickly respond to market changes and find emerging pullbacks, corrections, trend changes or predicted flats as early as possible.
Often, single time frame charts trick traders into identifying the prevailing trend.
Working with multiple trading periods allows you to eliminate false signals, thereby increasing the percentage of profitable trades.
Among the minuses are the following:
Difficulty understanding information. This issue is especially relevant for novice traders. Many people get confused when working with multiple graphics.
The need for a more thorough market analysis and strategy development.
We can say that the overall multi-timeframe analysis significantly improves the trading process.
As I explained above about multi-timeframe time analysis, in this question I will explain about determining entry points by applying multi-timeframe analysis.
I am here using the BTC/USDT asset in analyzing using a multi-timeframe, I will explain about the time frame chart from the long time frame to the short time frame.
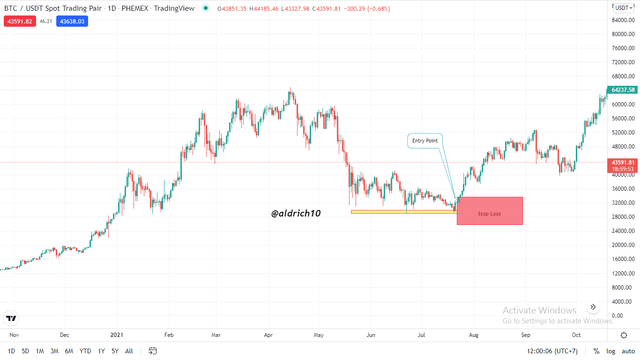
In the picture above is a chart of BTC/USDT using the 1 day (1D) time frame this is included in the long time frame. we can see in the picture above I have marked the support line and the trend is moving to become a bullish trend in the market. so I set the entry point or entry at that time and set a stop loss below the support level.
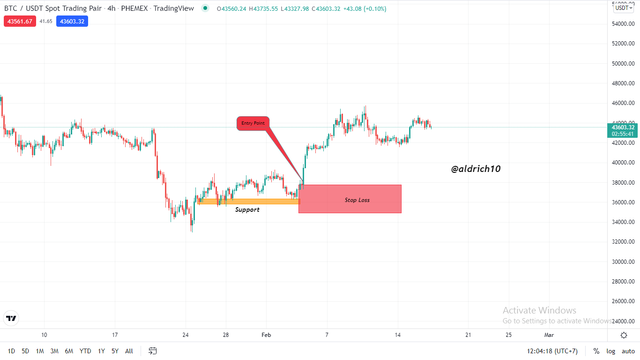
After we set the chart on the 1 day (1D) time frame here I will set the 4 hour (4h) time frame. In the picture above I have marked the support line on the 4 hour time frame and have set a Stop loss below the support line, here I have set the entry point or entry as I marked in this picture to be the entry point that I have set on the lower time frame from the previous time frame.
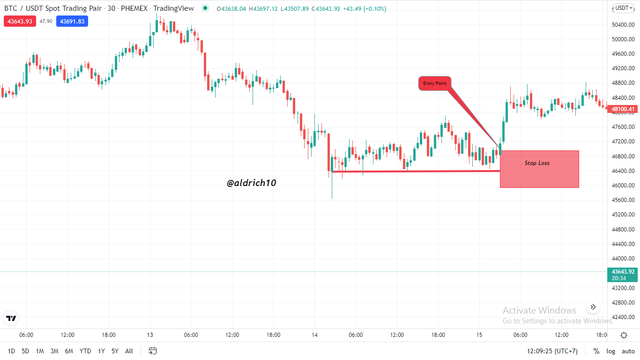
For the last time frame I set a smaller time frame which is 30 minutes and in the picture above I have marked the support line and I have also determined the support where the next trend is a bullish trend at this point it becomes the perfect entry point and set a stop loss below support line.
In solving this problem I will trade using time frame analysis and by using support lines and resistance for trade setups. As for trading this time I use the ETH chart and here I use the time frame from the long to the shorter time frame and I also set the entry point, Take Profit and stop loss.
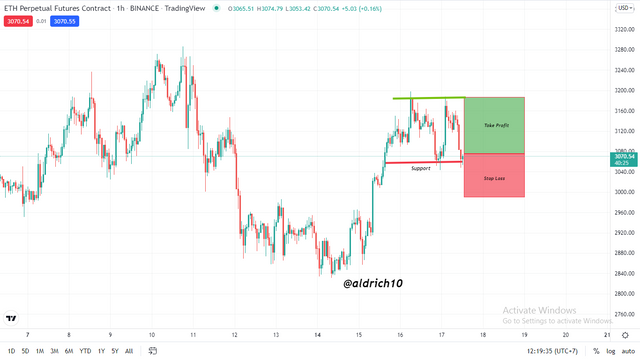
In the picture above we can see that I am using the 1 hour time frame and here I have set a support line on the chart where on the chart there is a signal that the next bullish trend will occur, this becomes an entry point in the trade and I also mark a stop loss and take profit.
Next we will use a faster time frame than before.
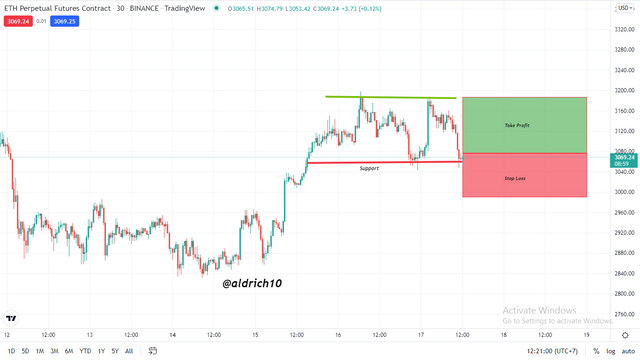
In the graphic image above is using a 30 minute time frame and I have also set a resistance line and a support line therefore I have set an entry point to enter the trade and also set a Stop loss and Take Profit.
The last timeframe I used was the 5 minute timeframe.
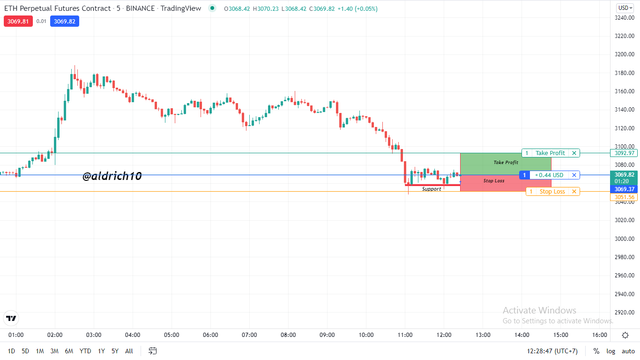
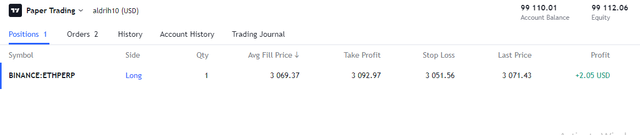
The chart above shows that I have identified a support line and the price in the market has shown a signal that a bullish trend will occur this is a sign that this is the right point to enter the trade and I have also set Take Profit and Stop loss for my trade. I made this trade using a demo account on tradingview. This image is a proof of my trading transactions.
Price action is the price movement of a security that is plotted over time on a chart. Price action forms the basis for all technical chart analysis of stocks, commodities or other assets. Many short-term traders rely solely on price action, patterns and trends extrapolated from them when making trading decisions. Technical analysis, as a practice, is derived from price behavior because it uses past prices in calculations that can then be used to make trading decisions.
Price action sometimes refers to the up and down movement of prices in the market over time.
Different views can be applied to the chart to make the price action trend clearer to traders.
Forms of technical analysis and chart patterns are based on price action. Technical analysis tools such as moving averages are calculated based on price movements and are predicted into the future to inform trades.