Trading Strategy with Median Indicator - Steemit Crypto Academy |S6W4| - Homework Post for Professor @abdu.navi03


1-Explain your understanding with the median indicator.
The median indicator is an indicator that is rarely highlighted, even to find information about the indicator can be said to be a little difficult, because there are not many articles that discuss it. It is a technical indicator that can be used to find entry and exit points in the cryptocurrency market. As with most indicators, the signals generated by the median indicator can be used to get a little picture of the market.
The median indicator works best in trending markets, as it is a trend-based indicator. The median indicator tries to measure the volatility in the market with a channel created using the ATR of the median line. The ATR of the median indicator is almost the same as the Bollinger bands indicator, which is plotted above and below or in other words the upper and lower bands, this serves to measure price volatility in the market.
We can also call the middle band as the median line, this is a line that is almost similar to the EMA. However, the median line is complemented by purple and green clouds, which are buy and sell signals. The colors used are green and purple, where green is a buy or bullish signal and purple is a sell or bearish signal.
The bullish trend is indicated by a green cloud and the median line along with the price is above the EMA line. While the bearish trend is marked by a purple cloud with the median line below the EMA and the price moving below it. The wider the upper and lower bands, the higher the volatility.
2-Parameters and Calculations of Median indicator.
How does the median indicator get its data, namely by collecting data on closing prices, openings, highs, and lows for a period. While the upper band and lower band use ATR and also a multiplier to then get the results.
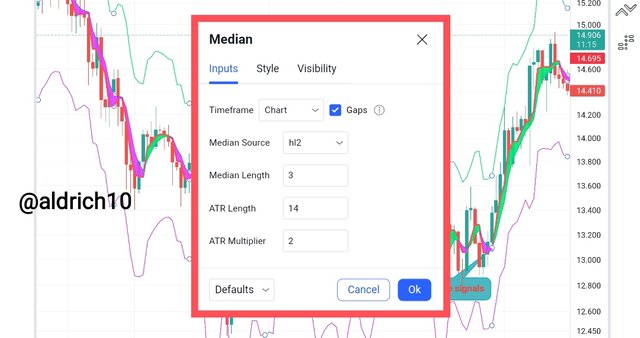
By default, the length of the median indicator is 3. And the ATR value by default is 14, for the ATR multiplier the default value is 2. The upper band is taken from the median length + (2 ATR), while the upper band is taken from the median length + (2 ATR). Lower band is taken from the median length - (2 ATR).
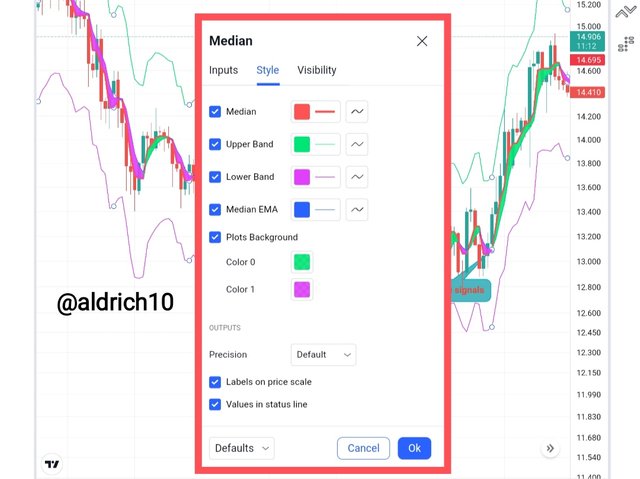
For display, we can also adjust it according to each taste. For example changing the color of the median line, EMA line, cloud color and others.
Everything I show above is the default setting, meaning that a trader can change the settings according to their own needs and trading style. But in my opinion, this indicator is not good for scalping, meaning that if the median length or the value of the ATR is reduced again, the indicator will generate a lot of false signals. So the default settings are good in my opinion.
3-Uptrend from Median indicator.
How to identify an uptrend signal on the median indicator, here I will try to explain it in a simple and easy to understand way.
Actually, this is a very simple indicator and very much like moving averages, also this indicator works on trending markets, so we can use this indicator to determine entry and exit positions in the market.
When an uptrend occurs, the median indicator gives a signal with a green cloud, also the median line will be above the EMA. So we can put an entry here, for more details, see the graph below.
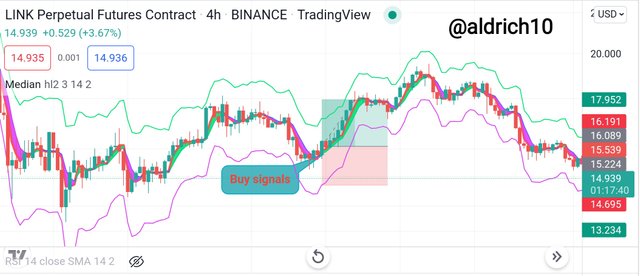
It can be seen that, when an uptrend occurs, the median cloud looks green with the median line also above the EMA and of course the price is above these two lines. The upper and lower bands are used to measure the current market volatility.
4-Downtrend from Median Indicator.
As I explained clearly in the description of the median indicator, when the downtrend occurs we can see that the median indicator will display a purple cloud color with the median line below the EMA. That is, we can pay attention to the signal of this indicator to determine a short position. When the purple cloud starts to appear with the median line going down below the EMA and price action is also below this line then we can immediately place an entry.
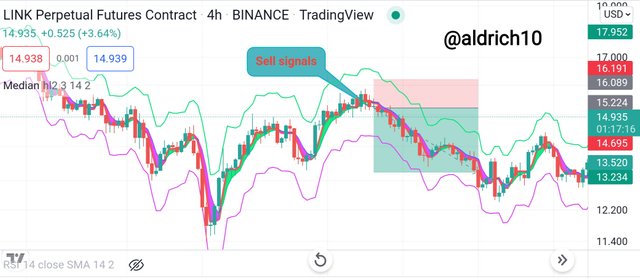
For example, the screenshot above shows how a downtrend signal is generated on the median indicator, and then we can go short. When a purple cloud is seen with the median line going down below the EMA, it is a sell signal or a downtrend will occur.
5-Identifying fake Signals with Median indicator.
It is clear that every indicator is not perfect, all of them will still produce false signals, as well as the median indicator. So to detect it is a fake signal or not, then we can use other indicators.
As we know, trend-based indicators lag behind prices because they use historical price data points. For that, we have to combine this indicator with other indicators for confirmation and also see and detect false signals.
There is one analytical strategy that is already very popular, namely Ichimoku + RSI. Because the Ichimoku is also a trend-based indicator, it is combined with the RSI which is a volatility-based indicator that gives signals when the market is overbought or oversold.
When the RSI is at 70 and above is a sign the market is overbought and a reversal is imminent. If the RSI is at the level of 30 and below, it indicates that the market is oversold, which indicates that a reversal will occur soon. So we can also combine the RSI with the median indicator to detect false signals or market reversals.
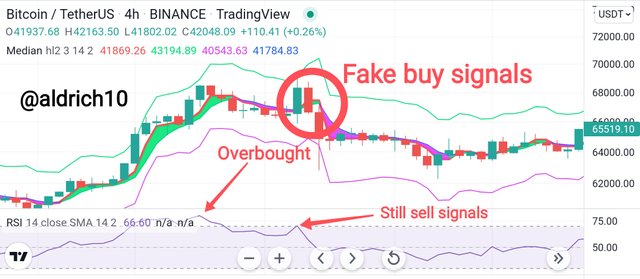
If you can't see it clearly, then try to enlarge the screenshot. It can be seen that the median indicator gives a buy signal but is immediately replaced by a sell signal.
If we use the RSI, we can see that previously the market was overbought and a reversal was taking place from bullish to bearish. So it is impossible to get a buy signal when the market has just reversed. So we can find out that the buy signal given by the median indicator is a false signal.
6-Two demo trades, long and short, with the help of a median indicator.
Long Trade (SRM/USDT
I tried to analyze the SRM coin, then got a clear buy signal from the median indicator. Here I try to follow the current trend, because the trend is bullish so I will open a Long position.
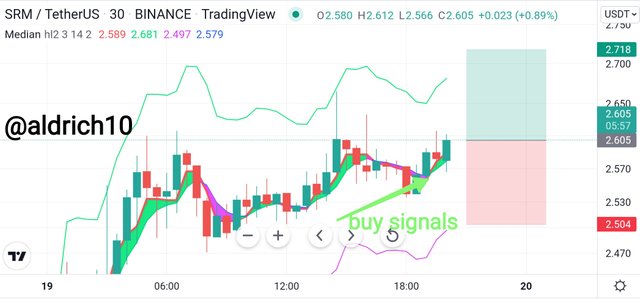
First, I analyzed this coin with the help of the median indicator along with the RSI, but I didn't display the RSI indicator so the picture could look bigger. Here I see buying after the price creates a higher low, usually the price will re-create a new highest high.
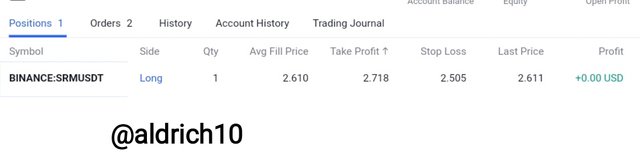
I placed my entry at $2,610, then I placed my take profit at $2,718 and my stop loss was below the previous higher low at $2,505. I use 1:1 risk management.
Short Trade (ETH/USDT
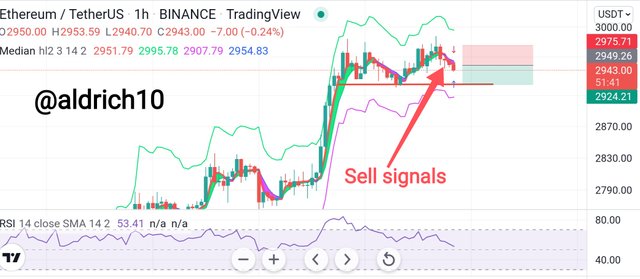
The ETH market looks overbought and a reversal is possible. Then I also saw a sell signal on the median indicator. I immediately executed short trades so as not to be late.
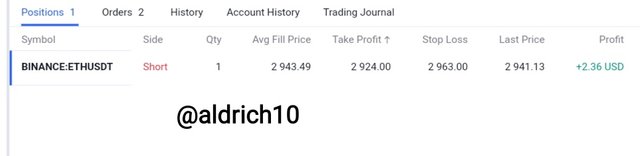
I immediately placed a short entry at $2943.49, to be careful I placed a take profit slightly above the previous support level at $2924 with a stop loss at $2963. The risk management I use is 1:1.
Conclusion
The median indicator is a technical indicator, but keep in mind that all indicators are not perfect, there are advantages and disadvantages. So it's a good idea to combine this indicator with other indicators as a filter for false signals or so on.
Trading is not as easy as we think, don't be fooled by people who can take thousands of dollars in profit, because we don't know the struggles they are going through and also the capital they have spent. The point is the risk is very large, so you must really learn the science of technical analysis first before plunging into the market.