Support and Resistance Breakouts - Steemit Crypto Academy |S6W3| - Homework Post for Professor @pelon53


The advantage of identifying support and resistance levels is very important when carrying out technical analysis in trading to get maximum results. However, support resistance levels may be familiar to experienced traders. This is the most basic knowledge for traders to be more successful with price exchange trading. However, for new traders, they may not fully understand the importance of these two concepts and even experienced traders sometimes mistakenly identify support and resistance levels.
It can be said that the resistance area will be the area that many traders fear and panic because they have bought a good price before and will immediately take profit because they are afraid the price will drop later and lose it. On the other hand, support is an area that makes traders even more greedy when they were previously unable to buy at a good price, so that when the price returns, they will simultaneously buy a lot in the hope that the price will rise soon. Resistance is a price zone where investors are afraid, while support is a price zone where investors are greedy.
Resistance and support lines are an integral part of any financial market. Market participants identify these levels, which essentially represent supply and demand, or order flows, which can change rapidly. Here, the bull and the bear are at odds with each other, with the one winning side always dominating, in one way or another. Prices can comply with or react to a price, where buyers or sellers match each other.
Support resistance can be understood as a horizontal price area, a certain price level or price level that is connected to a high or low price. When support resistance appears, a price trend reversal will form, changing direction to create the next high and low. However, resistance and support levels can be repeated many times from the previous trend to the present and into the future.
Resistance and support are price zones that existed in the past where the price had reversed or slowed down before the price resumed the trend, that leveling behavior repeated many times into the future. If the price area rises and then falls again, it is called resistance. Conversely, when the market price shows signs of rising again, the area of the lows also increases, a sign of a support line.
A break of a weak support or resistance level usually means that the trend will continue in either direction. On the other hand, a breakout of a strong support or resistance level is not very reliable. You must first observe the price behavior before the price touches that level. This will help you identify the tipping point - that is, the actual pimple.
If the breakout is real, don't be too hasty in making a decision. Wait a bit for the market to start behaving the way they did before reaching a support or resistance level. You have to make decisions based on developing trends. If an uptrend seems to be developing, enter a long position. If a downtrend seems to be developing, enter a short position.
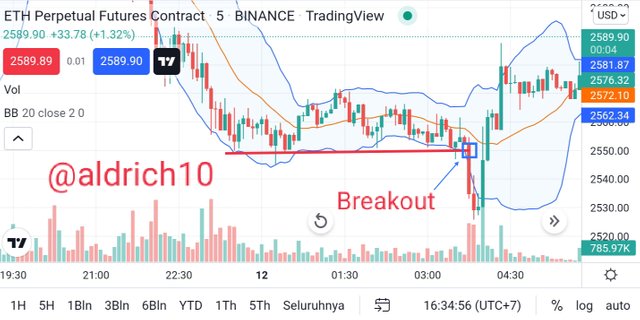
- Breakout of support
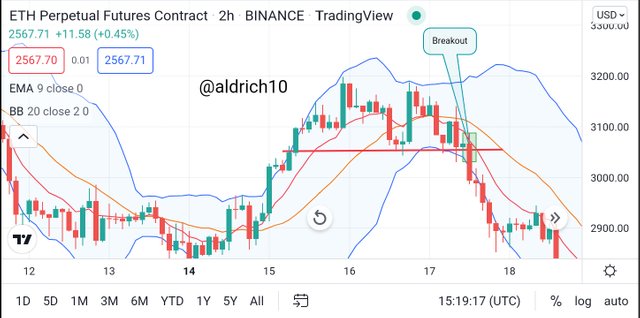
- Breakout of Resistance
If the price breaks through a weak support/resistance level, you can expect the trend to continue in the same direction. In the case of strong support/resistance, consider how the price behaves when it hits these levels.
If you look at our snapshot above, the price usually develops in a downtrend. If a breakout occurs, wait until the market behaves as it did when the price touched a support/resistance level. It's time to enter a trade based on the developing trend.
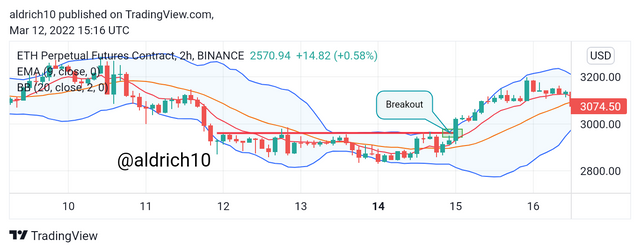
To determine if a support level breakout is correct, the same rules apply, but in a mirror image. There are various approaches to the truth breakdown criterion. In particular, various sources recommend monitoring the price behavior after the break of the levels from period 1 to 5 according to the timeframe of the chart. A true breakdown means a trend change or price stabilization in a flat trend. The first sign of the correctness of the breakdown is a retest of the level broken from the opposite side or the successive closing of candles on the side of the new level (early consolidation).
Sometimes prices often break through support levels. It might be a good idea to use the additional help of some additional tools and indicators. Thus, your trading will be more consistent. You can try the Bollinger Bands indicator like the chart above or one of the well-known oscillators to help you identify oversold and overbought areas. This can improve the performance of your market decisions.
The key is to identify support/resistance levels and act accordingly. But it takes extra patience to master this skill. Your goal is to determine the right time to enter the trade after the price breakout.
Fake pimples are a trader's nightmare. They have brought harm to many people. We can talk about a fake breakout when the price drops back into the range after breaking the support/resistance level.
To avoid losing money on false breakouts, you need to carefully analyze the charts. Watch which trend develops when the price hits a strong support or resistance level.
See the example below. The price reached resistance but continued the downtrend thereafter. When you see a price breakout but still beyond the support/resistance (resistance in our example), it could signal a false breakout.
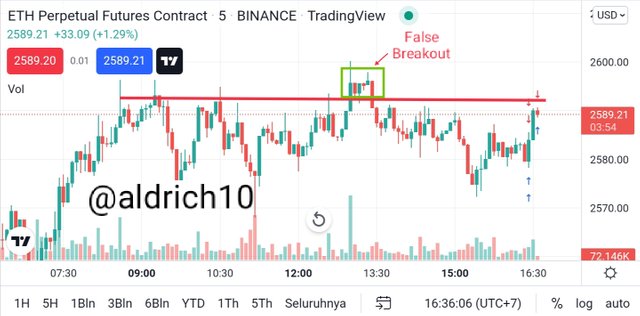
Look at the solid red candle that broke the newly created support (before it became resistance). This indicates a downtrend and this is the right time for you to enter a short position as this is just a false break of the resistance line.
- how to avoid False Breakout
It is very important for traders to know how the conditions of price movement are when they reach resistance and support lines. This will help you make good trades when they happen again.
To gather this knowledge, you must read the chart carefully. My advice is to use a time frame chart that is larger than your trading period. Let's say you trade a 5 minute candle. I recommend using at least a 30 minute chart. It can also be a 1 hour chart.
Sometimes prices often break through support/resistance levels. It might be a good idea to use the additional help of some additional tools and indicators. Thus, your trading will be more consistent.
In trading I use a demo account on the trading platform views using KNC/USDT assets.
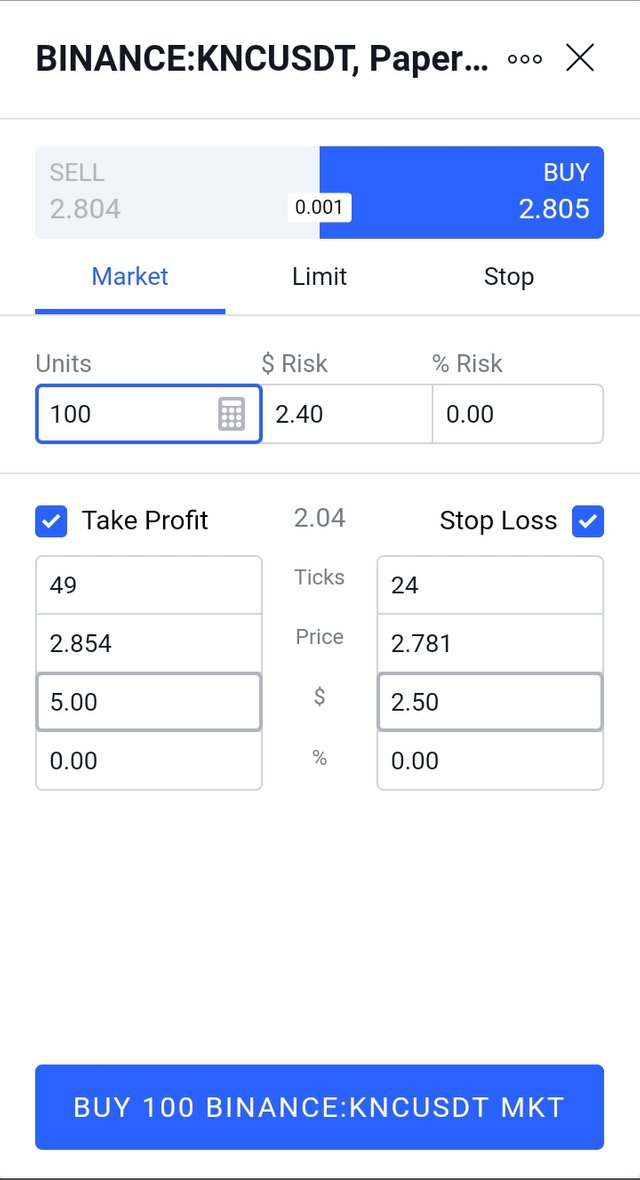
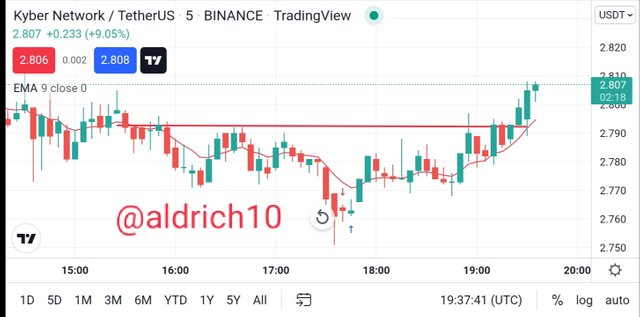
In the picture above we can see that I made a buy order with a demo account at a price of $ 2,805 using take profit at a price of $ 2,854 while for a stop loss of $ 2,781 for the amount of 100 KNC coins. According to my analysis, the price in the market has broken through the resistance line and also uses the MA indicator to inform the market price will be an uptrend and uses a 1:2 ratio.
In trading I use a demo account on the trading platform views using FTM/USDT assets.
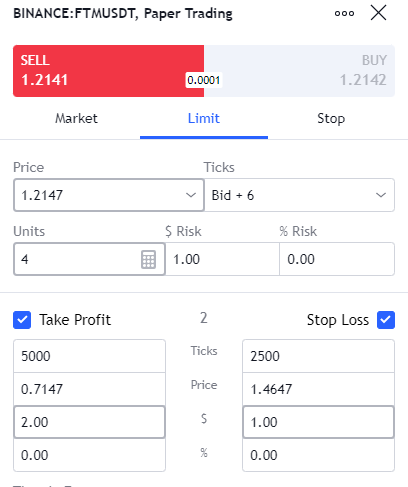
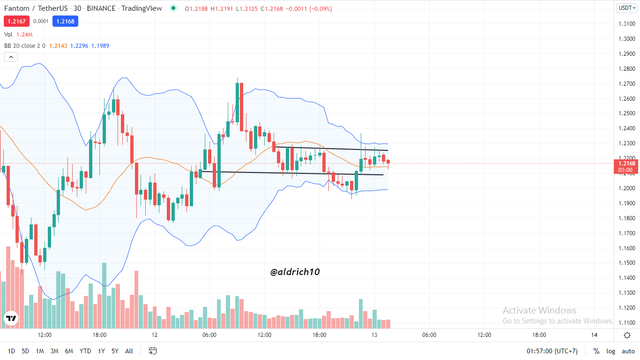
In the picture above we can see that I placed a sell order with a demo account at a price of $1.2141 using take profit at a price of $0.7147 while for a stop loss of $1.4647. According to my analysis, the price in the market has broken through the support line once and is about to break through it again. I also use the Bollinger band indicator to inform the market price will be bearish. This is also confirmed by the candle that crosses the lower band. This indicates that the next market price will break the support line and in a 1:2 ratio.
Support resistance can be understood as a horizontal price area, a certain price level or price level that is connected to a high or low price. When support resistance appears, a price trend reversal will form, changing direction to create the next high and low. However, resistance and support levels can be repeated many times from the previous trend to the present and into the future.
Resistance and support are price zones that existed in the past where the price had reversed or slowed down before the price resumed the trend, that leveling behavior repeated many times into the future. If the price area rises and then falls again, it is called resistance. Conversely, when the market price shows signs of rising again, the area of the lows also increases, a sign of a support line.
All pictures are taken from TradingView