Reading Special Bar Combinations - Steemit Crypto Academy - S5W8 - Homework Post for @sachin08


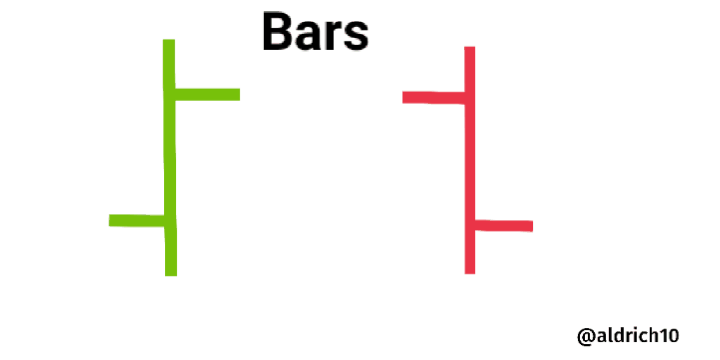
Bars are vertical lines, each of which shows how much the asset's value has decreased or increased over time. To create a bar chart, a trader needs to know four main indicators - opening and closing prices, as well as minimums and maximums.
The horizontal bar lines show the open and close prices. By looking at a bar chart, a trader can get a better idea of how the price of a digital currency has changed over time.
Unlike line charts, here traders have access to information about the difference between the opening and closing prices. This is the bar chart that is most often used when it is necessary to determine the moment of market consolidation. But for the short term time frame, this chart is very uncomfortable.
Design by me using Canva & gif maker
Description of the image :
Open is the open price. It is represented on the graph by a small horizontal stroke to the left of the vertical bar line. This stroke is located on the chart at the price level at the start of a new time period (minutes, days or weeks, depending on the selected timeframe).
Close is the closing price. It looks like a horizontal stroke to the right of the main trunk body. Its location on the chart corresponds to the price of the last asset before the close of the specified time period - the timeframe.
Height is a positive extreme. This is the highest price reached by the quote of an asset (cryptocurrency, stock or currency pair) during trading for 1 period of time defined by the timeframe. On a bar chart, this level corresponds to the top point of the vertical bar line.
Low is a negative extreme. The minimum price at which the underlying asset is traded over a period of time. The lower point of the vertical bar line is exactly at that minimum price level.
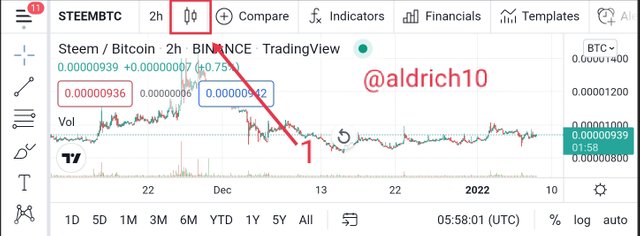
How to add price Bars to the chart
There is a way to add price Bars to the chart, Here I am using market tradingview to complete this task.
- The first step: Open the tradingview page after entering the chart view then click the icon as shown in the image below to select Bars.
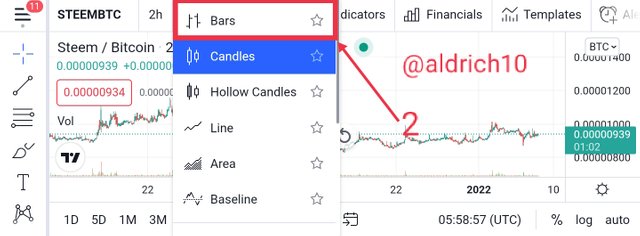
- The second step: Next there will be a menu display to determine the graph that we will use, here select the Bars menu as I show in the image below.
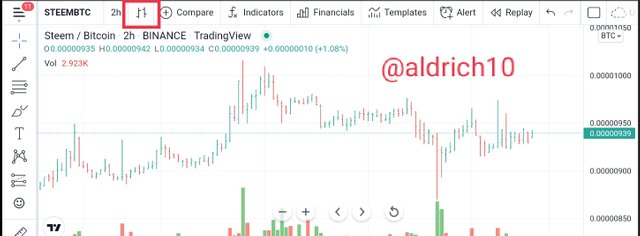
After doing the two steps I described, the Price Bars display will appear as shown in the image below.
OHLC chart - open, high, low, close (open, high, low, close). Used to combine price movements over a certain period of time. The Open price is indicated by the line to the left of the vertical bar. The closing price is the dash to the right of the vertical bar.
The top point is the top of the blade and the lowest point is the bottom of the blade. The position of the opening and closing prices will change. Based on the relationship of these two prices to other price bars on the chart.
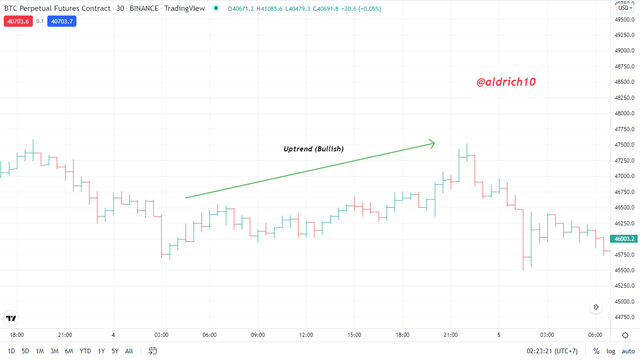
- Bullish
When the price closes above the opening bar. The price bar is then called a bullish or bullish bar. The definition of a trend is usually defined. based on the ratio of the highest and lowest (price bars). So, over time, price bars have highs and highs. The bar then moves in an uptrend. This chart shows an uptrend. It consists of bars with successively higher highs and lows.
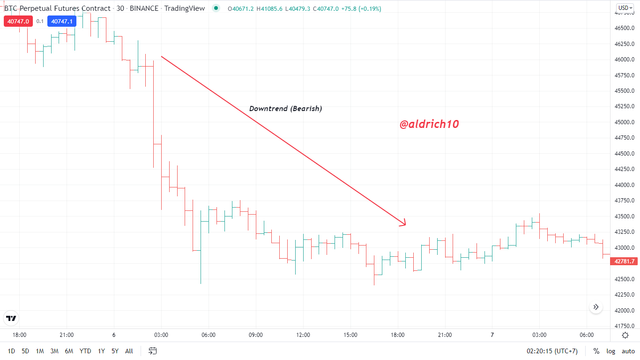
- Bearish
If the closing price is lower than the opening bar. The date is then summarized as the cut or cut date. A downtrend is formed by successive bars with lower highs and lower lows. If the price of the bar has a peak and a minimum, the bar is moving in a downtrend.
In spending a good day in a Bearish and Bullish trend, it causes speculation in the condition of the bars in this market to be a dilemma whether to go up or down, in such conditions that we can be hesitant to invest. The top point is the top of the blade and the lowest point is the bottom of the blade. The position of the opening and closing prices will change. Based on the relationship of these two prices to other price bars on the chart.
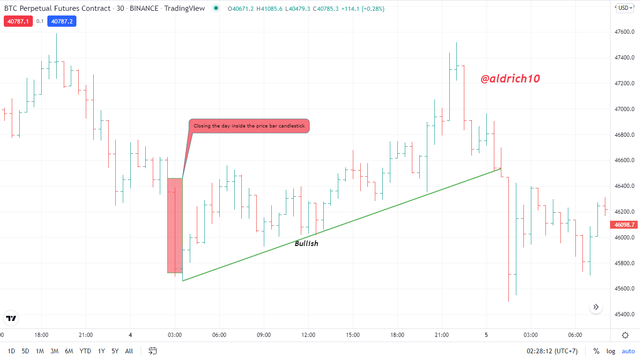
- Bullish inside
After a series of highs and lows, a downtrend is formed. The moment when the price of the bar begins to move up and down. Perhaps this is a positive signal for a price reversal. Typically, a reversal bar consists of a higher high and a lower low. Must make a strong break from the previous solid downtrend.
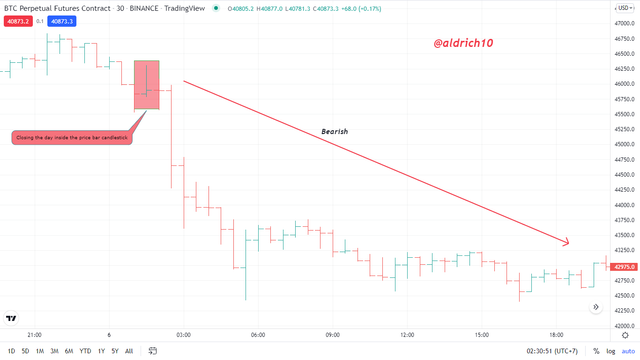
- Bearish inside
After a series of peaks and bottoms, an uptrend gradually forms. The moment when price bars start forming lower highs and lows. May be a potential signal for a reversal in price action. Typically, a reversal bar consists of a lower high and a lower low. Should make a strong break from the previous solid uptrend.
The problem with exiting bars is where there is a possibility of a market reversal or trend continuation. In such conditions we need to pay attention to the prices of the close and open on the bars that appear on the day and the lows and highs.
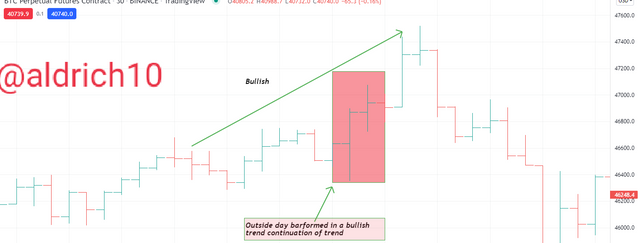
- Bullish to come out on the day
The condition of the candle on the chart that shows a bearish trend, we can see that there is an open from the highest price and the closing price is close to the high, but usually the closing price is the highest price of the previous bar price from the previous high price.
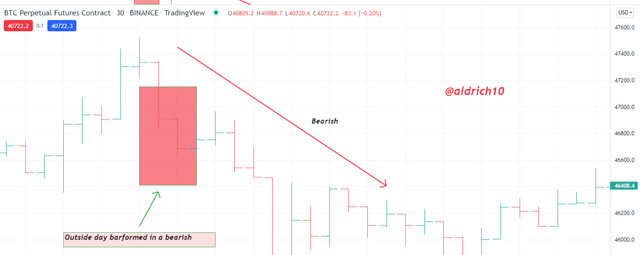
- Bearish out for the day
The condition of the candles on the chart which shows the next trend will be bearish, we can see that there is an open from the highest price and the closing price is close to the low, but usually the closing price is low from the previous bar conditions and also from the previous low price.
The open price is the price at which a trade between a buyer and seller occurs. The opening price is very important, mainly because of its relationship to the closing price of the previous bar and the closing price of the current bar. If the opening price is higher than the previous day's close. Then we know that the break has occurred.
The overnight price hike can be attributed to some of the upbeat news often seen in the market. Or maybe the buyers were unable to enter the market at the close of the previous day. And they want to make sure they get the next day's opening price.
The current closing price is the most important of the four OHLC prices. The closing price can be thought of as a summary of one day's trades. The position of the closing price on the chart. Can tell if the day is in the control of the buyer or seller. When the price closes near the top, it is clear that the buyers won the day. When the price closes near the bottom, we can conclude that the sellers won. And when the price closes in the middle of the bar, neither side wins.
The closing price will be very useful in analyzing its relationship to the high and low prices. With the opening price of the day and the closing price of the previous day. Moreover, if the closing price is higher than the opening price, then the bar is called a “bull day”. If the closing price is lower than the opening price, the day will be bearish.
- Close and open for bullish
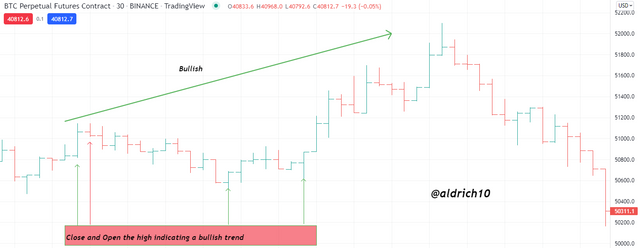
We can see from the picture above where on the chart it clearly indicates that a Bullish trend will occur because the candlestick conditions form a high that is higher than the opening price and the closing trend is seen close to the highest price. As for trend reversal conditions, this can occur at any time because the opening and closing conditions are close to the lowest price.
- Close and open for bearish
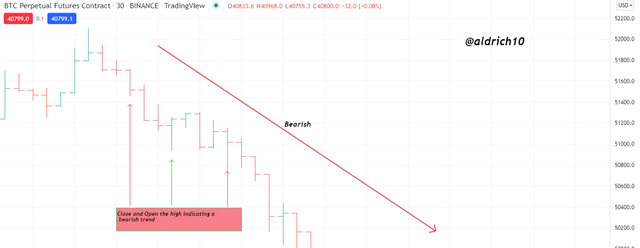
For the opening and closing of the bearish trend, this is the opposite of the bullish trend where the lower low conditions with the opening and closing are in low conditions. As for trend reversal conditions, this can happen at any time because the opening and closing conditions are close to the highest price.
Bars are vertical lines, each of which shows how much the asset's value has decreased or increased over time. To create a bar chart, a trader needs to know four main indicators - opening and closing prices, as well as minimums and maximums.
The upper point of the bar is the maximum price, the lower is the minimum price, the right line is the closing price, the left is the opening price. The chart allows you to analyze how the price changes in the trading period.
The main advantage of bars is their informational content. Unlike line charts, they show four price values for the selected period at once.