Fibonacci Tools - Steemit Crypto Academy |S6W4| - Homework Post for Professor @pelon53


Fibonacci retracement is a popular technical analysis tool used by traders to predict potential future price movements in financial markets. If used correctly, Fibonacci retracement levels can help traders identify upcoming support and resistance levels based on past price action.
It is important to remember that Fibonacci levels are confirmation tools. For this reason, Fibonacci is best used in conjunction with other technical analysis tools such as trend lines, volume, moving average convergence divergence (MACD) and moving averages. In general, the higher the number of confirming indicators, the stronger the trading signal.
The sequence of numbers as well as the famous Fibonacci golden ratio, they are sequences of numbers where the next number is simply the sum of the two previous numbers. So, for example, it will run 0, 1, 1, 2, 3, 5, 8, 13, 21, 34, 55, 89, 144 etc, in a sequence that continues indefinitely.
Analysts can use this approach when learning how to trade Fibonacci retracements. Say for example an asset has increased in price and like all markets for the same price of another asset it cannot increase in a straight line but must decrease before continuing to rise. Traders will look at the Fibonacci ratios to try and figure out where the downward momentum may stop and the market will continue to advance before that.
Fibonacci retracement levels often mark reversal retracement points with surprising accuracy. Retracement levels are a powerful tool that can be applied to all time frames, including day trading and long term investing.
We can use Fibonacci retracement by taking the bottom and top of the uptrend on the chart and then dividing the distance by the key Fibonacci ratios mentioned above. Once these levels are identified, they are used as important support and resistance levels to help us predict price movements.
Fibonacci retracement levels are often used as part of a trend trading strategy. If a retracement is taking place in a trend, you can use Fibonacci levels to trade in the direction of the previous trend.
Just as price retracements are assumed to end at or near the Fibonacci numbers, the core assumption of Fibonacci extensions is that when a trend continues, it will move as far as the Fibonacci numbers. The idea is that you can use Fibonacci extensions as price targets just as you can use Fibonacci numbers as stops. Fibonacci extensions are also called "projections", reflecting that Fibonacci extensions are attempts to identify future support or resistance.
The default rates are 0.0%, 23.6%, 38.2%, 50.0%, 61.8%, 100.0%, 161.8%, 261.8% and 423.6%. As noted in a previous lesson, 50% and 100% are not Fibonacci numbers but have a clear appeal to the pattern-seeking human brain and were adopted as key numbers by WD Gann.
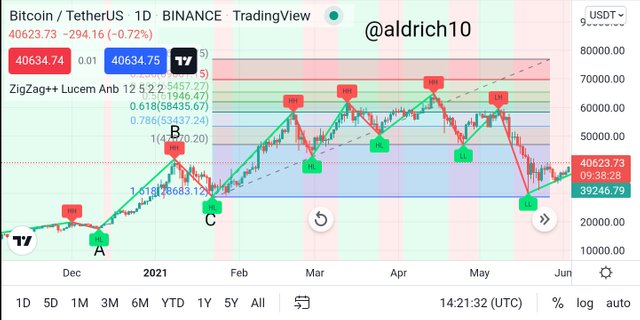
See an example graphic below. Point A marks the low and Point B marks the high before the pullback. If we think the pullback is temporary and will turn back into an uptrend, we'd like to know the extent of the move. Choose the price at Point A and the price at Point B and multiply the lowest price at Point C by each of the different Fibonacci numbers as a percentage. The 50% level here represents 50% of the transition from A to B applied to C.
Fibonacci retracement levels have no formula. When this indicator is applied to the chart, you select two points from high to low (downtrend) and from low to high (uptrend).
Once those two points are selected, a line will be drawn as a percentage of that move. The formula for the Fibonacci retracement is as follows:
X + (1 - %retrace / 100) * ( Y - X)
Information :
Y is the highest price
X is the initial price
The levels are as follows:
Retracement 1 = 23.6%
Retracement 2 = 38.2%
Retracement 3 = 50%
Retracement 4 = 61.8%
Retracement 5 = 78.6%
Now that we know the formula for the Fibonacci retracement, let's calculate the levels of 0.618 and 0.236.
- Fibonacci calculation for the level from 0.618
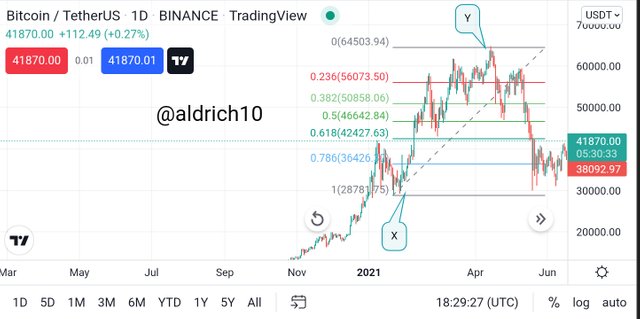
From the BTC/USDT chart above we can find out for X and Y as follows:
X= 28781.75
Y= 64503.94
Let's count:
= 28781.75 + (1 - 0.618) x (64503.94 - 28781.75)
= 28781.75 + (0.382 x 35722.19)
= 28781.75 + (13645.88)
= 42427.63
The Fibonacci retracement of the 0.618 level in the chart above is : 42427.63
- Fibonacci calculation for the level from 0.236
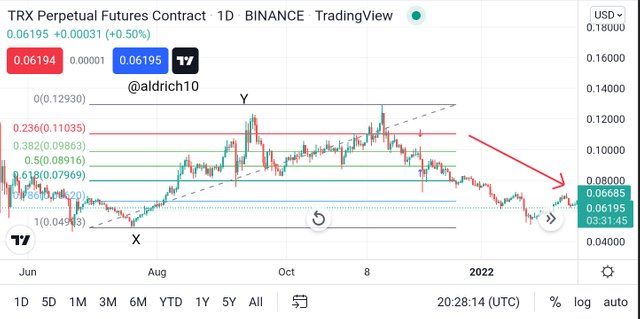
From the TRX/USDT chart above we can find out for X and Y as follows:
X= 0.04903
Y= 0.12930
Let's count:
= 0.04903 + (1 - 0.236) x (0.12930 - 0.04903)
= 0.04903 + (0.764 x 0.08027)
= 0.04903 + (0.06132628)
= 0.11035
The Fibonacci retracement for the 0.236 level in the chart above is : 0.11035
In making this real trade using the Fibonacci retracement tool for analysis I will do it on tradingviews while for the trade I will do on Binance.
- AKRO/USDT buy trade
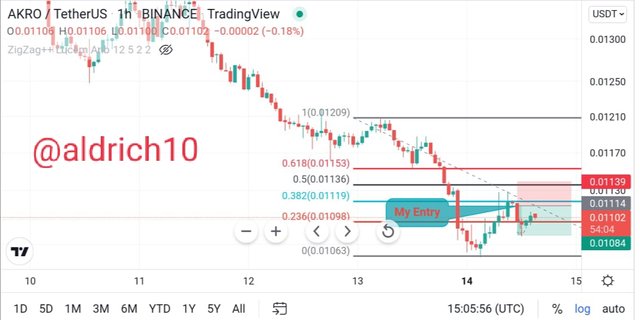
We can see in the chart above that the price movement in the market is in a downtrend here I use the Fibonacci retracement from the lowest price point of $0.01063 while for the highest price of $0.01209. To make Entry points at the price of $0.01119 because there will be a downward reversal, I set Stop loss at the price of $0.01136 and set Take Profit below the 0% level because it is possible to break it.
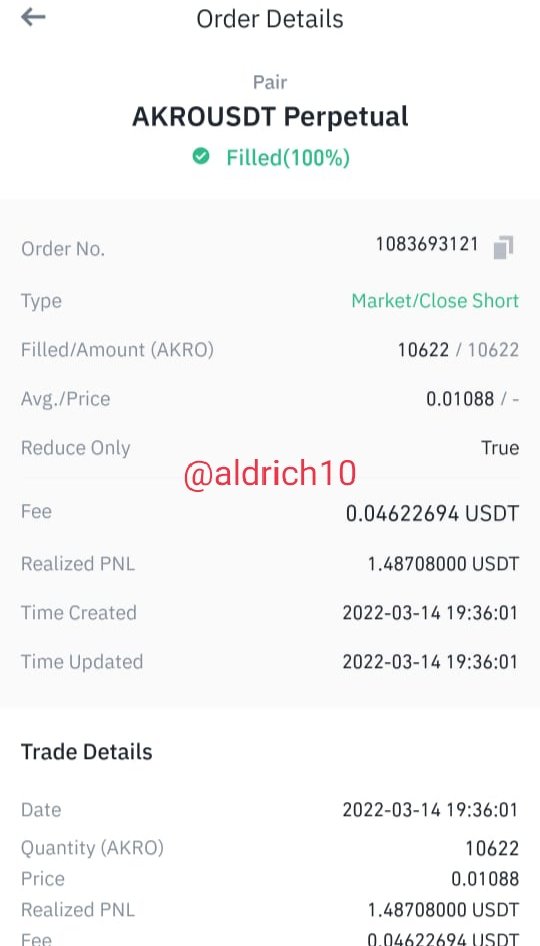
- Trade transaction details
In making this real trade using the Fibonacci retracement tool for analysis I will do it on tradingviews while for the trade I will do on Binance.
- IMX/USDT buy trade
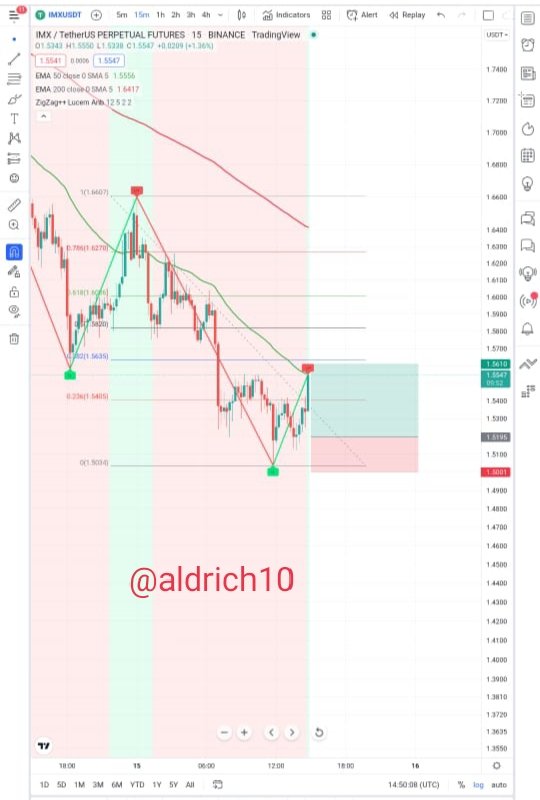
We can see in the chart above that the price movement in the market is in a downtrend here I use Fibonacci from the lowest price point of $ 1.5004 while for the highest price of $ 1.6007 To make an Entry point at the price of $ 1.5105 because there will be a reversal to the top, I set Take Profit on the Fibonacci line 0.382% level at $1.5010 and Stop loss below the 0% Fibonacci line at $1.5001.
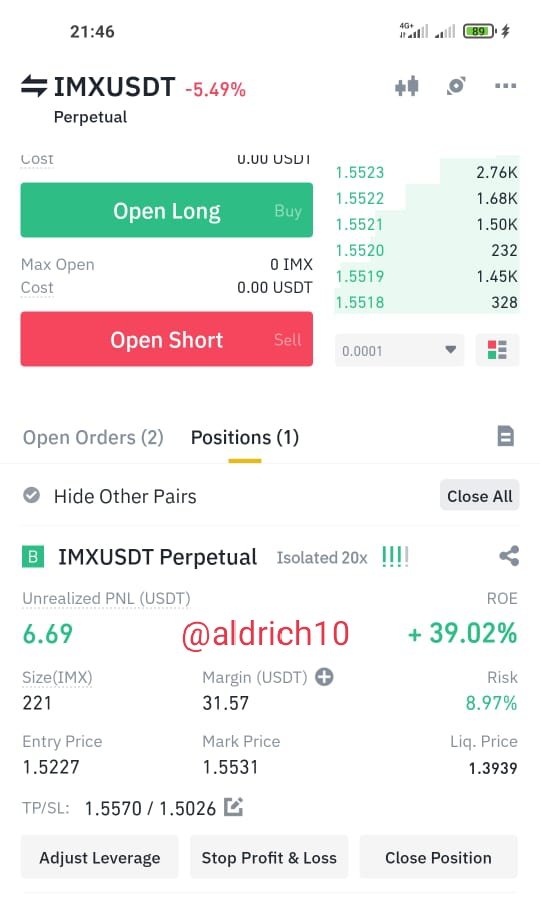
- Trade transaction details
Like all other technical analysis tools, Fibonacci retracements are most effective when used in trading systems. Using a combination of several different indicators provides an opportunity to more accurately identify market trends, increasing potential profitability. As a general rule, the more confirming factors, the stronger the trading signal.
Not everyone likes to use Fibonacci retracements to analyze the market. However, even for beginners, it can provide an extra level of understanding of potential market reversals. We should stick to risk management strategies when using technical indicators in trading.
thank you sir