Double Top and Wedge Trading - Crypto Academy S6W2 - Homework Post for @image


- Double Top
Double Top is an important pattern in technical analysis. This pattern is widely used by traders because of its easy recognition, high efficiency, and helps investors detect impending reversal signals and determine the correct entry point.
Visually, the Double Top is shaped like two mountains or just like an M. Double tops are usually at the end of an uptrend. This is a sign of a reversal from an uptrend to a downtrend. In an uptrend, when the price rises, meets an impenetrable resistance line, a peak will form. After that, the price trend reversed but was unable to break the support line so a lower center was formed. After falling, the price returns to the top again. However, the price continued to fail to break through the tops and fell again. At this point, a double top pattern will form.
- Double Bottom
The Double Bottom is a type of price reversal pattern, consisting of two consecutive lows that roughly equal a medium high in the middle.
The double bottom pattern (also known as the double bottom pattern, double bottom pattern) is widely used in technical analysis. This is a price reversal pattern, usually appearing at the end of a downtrend and preparing to turn a downtrend into an uptrend. This means that when you see a double bottom, a bullish forecast is imminent.
The double bottom resembles the letter W. The price fell to the first bottom and then rallied slightly higher before again forming a second bottom. After that, the price won't be able to press anymore, the sellers will give up and the price will rise sharply from this area.
- Wedge
Wedge is a pattern that signals a break in the current trend. When you encounter these patterns, they signal that the forex trader is still deciding where to take the next currency pair.
A wedge formation can signal continued volatility or reversal. A wedge is a triangular prism-shaped tool, its shape is similar to an inclined plane. Wedge is divided into two types, namely Rising Wedge and Falling Wedge.
- Rising Wedge
Rising Wedge is a chart that signals a downtrend, where the price fluctuates with a wide range at the bottom and gradually narrows as the price moves higher. Such price action forms an upward wedge as the highs and lows follow a converging channel. Rising Wedge can be a trend continuation chart pattern or it can be a reversal chart pattern.
As a trend continuation pattern, the Rising Wedge is still pointing up but against the direction of the main trend (i.e. downtrend) and When it becomes a reversal pattern, the Rising Wedge is pointing up and in the direction of the main trend (which is an uptrend). Regardless of its shape, the Rising Wedge is still a chart pattern that signals a downtrend.
- Falling Wedge
The Falling Wedge is a chart that signals an uptrend, where the price fluctuates with a wide range at the top and gradually narrows as the price drops. Such price action forms a downward wedge as the highs and lows follow a converging channel.
The Falling Wedge can be a trend continuation chart pattern or it can be a reversal chart pattern. When it is a trend continuation pattern, the Falling Wedge is still pointing downwards but opposite to the direction of the main trend (which is an uptrend). When it becomes a reversal pattern, the Falling Wedge points down and in the direction of the main trend (which is a downtrend). Either way, the Falling Wedge is a chart pattern that signals an uptrend.
Double Top
double top neckline generally upwards
The final settlement of this type of pattern is completed with the price breaking through the mid-low support, the upward driving force of the market has been exhausted.
The heights of the two peaks are similar. The highs will be within 0% to 4% of the first peak (depending on the time frame).
The price suddenly drops after breaking the support level of the neckline (this level is the price level below between the peaks).
Formations form over a longer timeframe, but of course, you can find them on any timeframe.
All three peaks have the same height.
When the neckline is broken, the volume increases sharply.
Double Bottom
The double bottom neckline is usually slightly downwards.
The final settlement of this type of pattern is completed with the price breaking the neckline support or resistance, and the confirmation process is completed with a pullback.
The height of both buttocks is similar. The lowest point of the second bottom will be in the range of 0% to 4% of the first bottom.
When the neckline (resistance level) is broken, the price suddenly rises.
It takes a long time to create a schema.
The heights of the three bases are similar, and the turning point is clearly visible.
When the price breaks through the neckline, the volume increases sharply.
Rising Wedge
The characteristic of the rising wedge is that after a period of sharp decline in the stock price, there is a strong technical rebound, and when the stock price bounces to a certain high, the price reverses and falls again. However, the decline was relatively light and moderate, so the stock price has supported and rose before falling to a recent low, and crossing the last high, forming a trend one wave higher than one wave. After the second gain ended at another high, the stock fell again. We connect the two highs and the two lows with a straight line, forming an upward sloping wedge. This is an ascending shape. During the formation of the rising wedge, trading volume continued to decline, indicating a characteristic rebound from rising prices and declining overall volume. The ascending wedge has been sorted to the end, with most of the break to the downside. Therefore, in essence, the rising wedge is just a rebound wave in the process of falling stock prices, and is a helpless struggle of the bulls after the continuous beating of the bears.
Falling Wedge
The characteristics of the falling wedge are: after a sharp rise, the stock price drops from a certain high to a certain low and rises, but fails to rise back up to the last high level, even if it is still far away, and will not retreat. The second drop broke the previous low but quickly recovered.
I connected two lows and two highs to form a downward sloping wedge-shaped cherry-shaped volume, which decreases from left to right, and the closer the stock price is to the top, the smaller the volume. the price rises and breaks the upper line of the falling wedge, the trading volume increases significantly, and a new uptrend begins.
During an uptrend, a falling wedge continuation pattern tends to appear when price volatility tends to consolidate or move sideways. Connecting a series of recent lower highs and lows resulted in two descending trend lines converging (falling wedge) before the price finally broke. If the price finally breaks above the falling wedge, the market outlook will usher in a sharp advance.
As seen in the bitcoin/dollar price chart below, it is clear that the price had broken above the falling wedge pattern then dropped back from the high level and returned to the wedge pattern. This is a real fake breakthrough in the financial markets. The false break highlights the importance of having the right stop loss level, which gives it some breathing room before the trade finally closes. I suggest that traders can place their stop loss at a suitable level below the lowest price level inside the wedge or even outside the wedge.
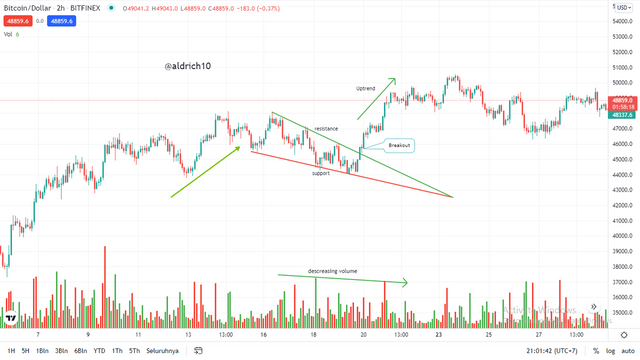
The stop-loss level trader must provide sufficient breathing room for the price to eventually break above resistance and return to a longer-term uptrend.
- BTC
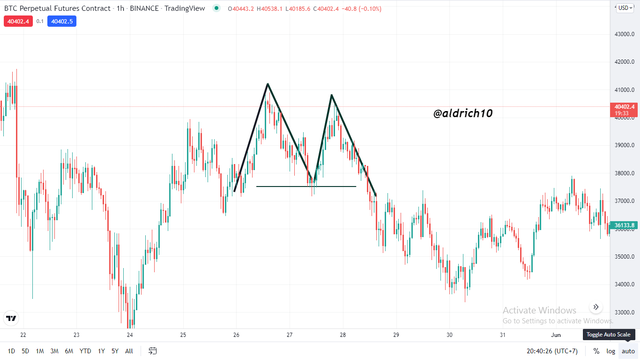
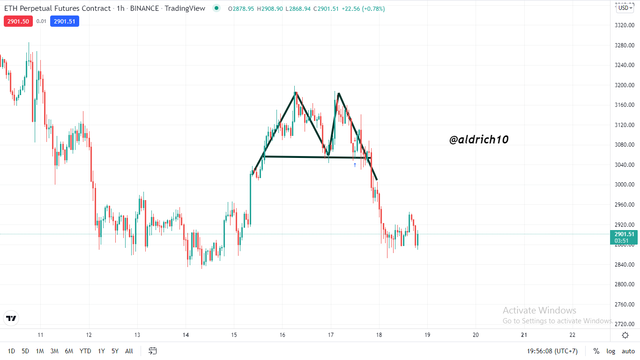
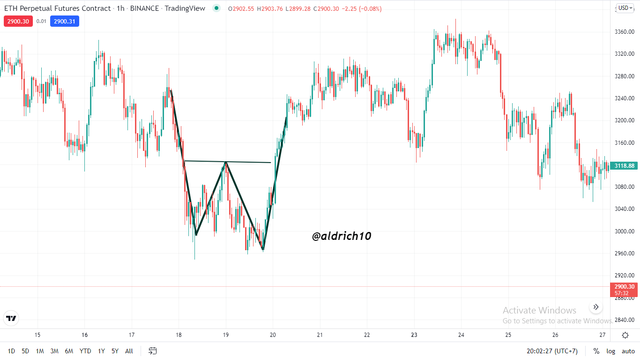
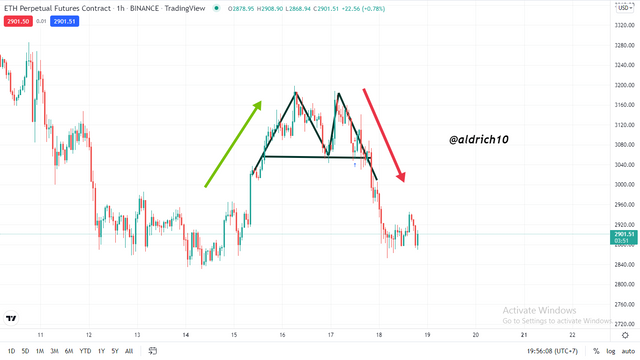
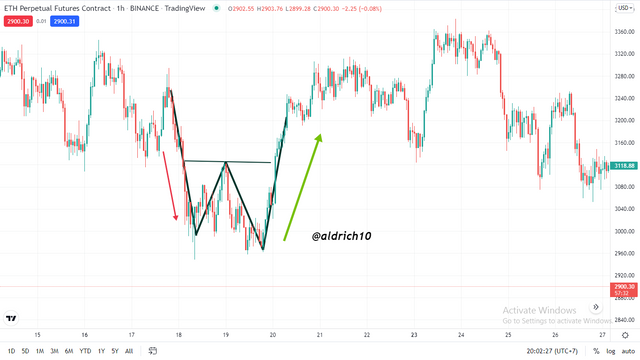
- ETH
In the two pictures above, the price reaches a certain value. It draws highs, then drops for a while, and then returns to roughly the same level and turns around again, drawing a second high for us. And after that, the price started to go up. We will call this pattern a double top. In an uptrend, when the price rises, meets an impenetrable resistance line, a peak will form. After that, the price trend reversed but was unable to penetrate the support line so that a lower center was formed. After falling, the price went back up again. However, the price continued to fail to break through the tops and fell again. At this point, a double top pattern will form.
Rising Wedge
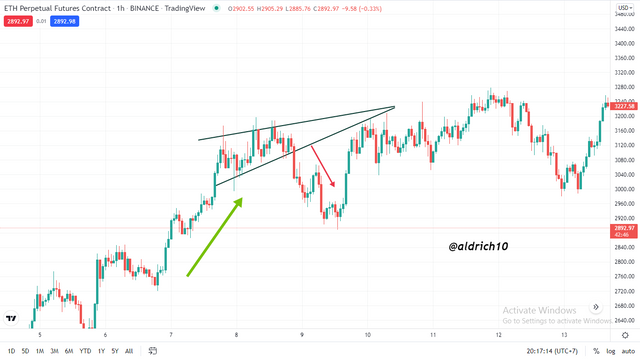
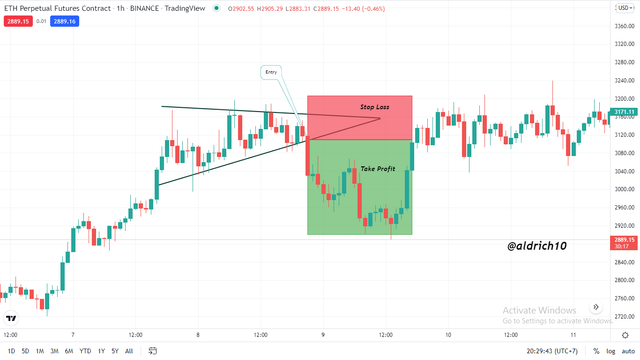
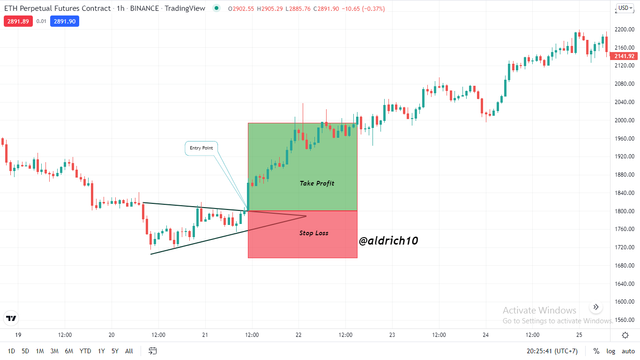
ETH
- TRX/TETHER
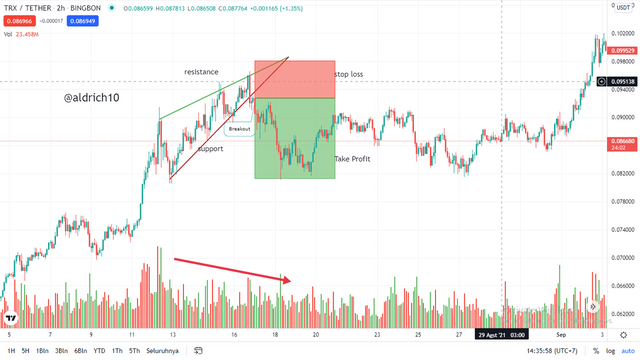
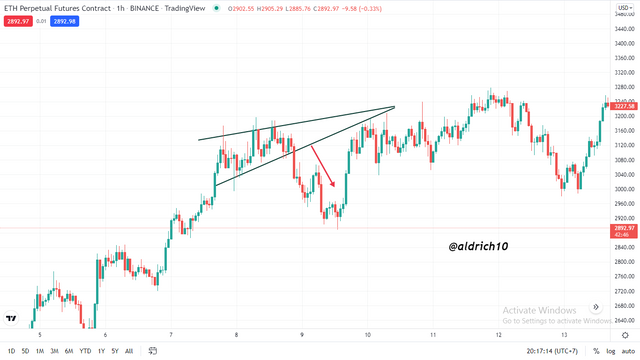
The two charts above show a continuation pattern after a definite downtrend. The rising wedge indicated by line two indicates that the bullish strength is diminishing in an uptrend. Confirmation of a weakening uptrend can be seen by using the volume indicator on the histogram which depicts a decrease in volume along with an increase in price in the market. This is known as a divergence, which indicates that the uptrend is coming to an end.
The entry point occurs when the trend support line of the rising wedge is broken. There are two common entry methods:
Wait for the candle to close below the trendline (support line) before entering the trade.
Enter a short position as soon as the price breaks the trend line, regardless of the close of the candle.
The stop loss levels marked on the chart are selected from the top of the rising wedge above the trend line (resistance). This makes determining stop loss relatively simple for novice traders. The cap (take profit) in this example is taken from the previous low which gives this trade a very positive Risk/Reward ratio.
- Falling Wedge
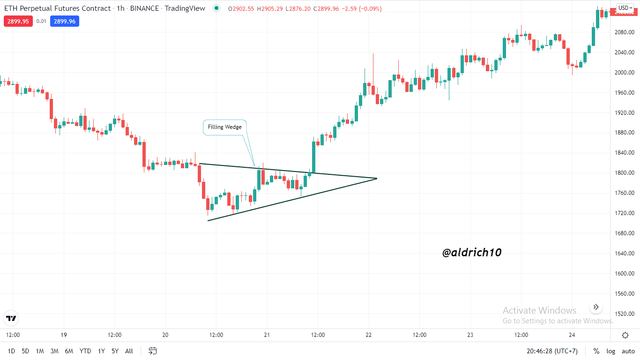
Traders can see the starting point of the falling wedge and measure the vertical distance between support and resistance. Then put the same distance in front of the current price but only if there is a breakout. That gap is the profit target.
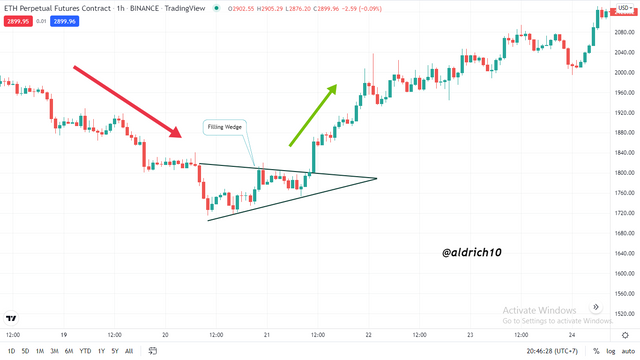
- ETH
- BTC/Dollar
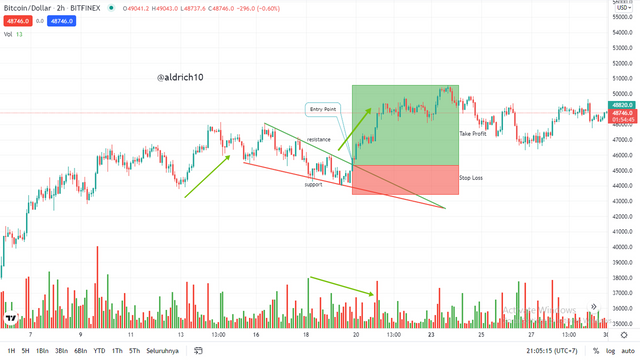
Traders can take advantage of falling wedges to spot reversal points in the market. The chart above presents one such case, with the market continuing its downward trajectory by making new lows. The price action then started moving sideways in a more consolidating pattern, before turning sharply to the upside.
Traders can analyze trend lines to connect lower highs and lower lows to make pattern detection easier. A break and close above the trend line (resistance) will signal a Buy order. Stop loss orders can be placed below the recent low, while targets can be placed according to the measurement technique discussed above; or at previous resistance - while sticking to a positive Risk/Reward ratio.
Important points to remember:
• Trend identification is very important
• Continuation and reversal scenarios tend to be bullish
• Both patterns have a Risk/Reward ratio because they often precede big moves.
Technical analysis is the use of data obtained from the history of the movement of each stock in the market, whether the trading price is fluctuating or fixed (Price) and its analysis. Trading volume (Volume) in a given time period (Time) with statistical tools and programs. Therefore, the information we have will allow us to see the behavior of stock movements in the past. And we're going to use the history of that stock's behavior. to be used in forecasting future stock trends to buy or sell those stocks to make a profit at the right time.
For technical factor analysis, they tend to prefer trend-following market characteristics. The market may be in an uptrend or a bull market, with higher highs and lows. Overall, prices can be seen jumping up and down in an uptrend frame. but otherwise If the market has the same price characteristics as mentioned above. Instead, switch to a chart with lower lows and lower highs instead, indicating bear market conditions.
The sideways trend is known as the Ranging market, which is the type of market that traders who follow the trend dislike. Due to the period when the price is taking a break We cannot predict what will happen next. Market range means that the market trend is neither up nor down at all. And it looks like the uptrend or downtrend is not stronger because the timeframe where the price doesn't change is not long enough to become a trend. Market prices are off about 60% of the time. This makes identifying market trends very important.
Technical analysts agree that investors will invest in a structured way. And with such behavior, technical analysts can accurately identify patterns and make profitable trades. All it takes is a little statistical data. Plus the repetition of price patterns and leverage.
Chart patterns are characteristic, repeating sections on a price chart, they are also called technical analysis figures or technical figures.
As a result of years of monitoring the market, it is known that chart patterns (or technical figures) periodically form on the price charts, which can be used to predict further price movements, there are several patterns that indicate a reversal signal in the market and patterns that indicate the continuation of the trend. It is important to note here that the probability of working outside the chart pattern is not one hundred percent, but, nevertheless, is high enough to use the pattern in trading.
Chart patterns are characteristic, repeating sections on a price chart, they are also called technical analysis figures or technical figures.
Double Top and Double Bottom are important patterns in technical analysis. This pattern is widely used by traders because of its easy recognition, high efficiency, and helps investors detect impending reversal signals and determine the correct entry point.
Wedge is a pattern that signals a break in the current trend. When you spot these patterns, they signal that the forex trader is still deciding where to take the next currency pair. A wedge formation can signal continued volatility or reversal. A wedge is a triangular prism-shaped tool, its shape is similar to an inclined plane. Wedge is divided into two types, namely Rising Wedge and Falling Wedge.
All pictures are taken from TradingView
Gracias por participar en la Sexta Temporada de la Steemit Crypto Academy.
Espero seguir corrigiendo tus futuras asignaciones, un saludo.
YOU DO NOT QUALIFY FOR #club75
hello sir @steemcurator02 can my next post use tag #club75 I have Power Up all my reward this week