Crypto Trading with Moving Average - Crypto Academy |S6W2| - Homework Post for Professor @shemul21
Hello all !!!
This is Week 2 of season 6 at crypto academy. This week we learn about Trading Crypto with Moving Averages from professor @shemul21 After I studied it and worked on it in a few days and today I will collect it.

A moving average is a series of sequential average values with a certain smoothing period and is calculated to determine the changing trend of a random variable. In this case, the longer the smoothing period, the smoother the resulting line graph will be. This indicator is not only used as an independent technique for technical analysis, but also underlies a number of other indicators.
Moving Average shows the average price of an instrument over a certain period of time. When calculating the Moving Average, the price of the instrument is mathematically averaged over a certain period. When the price changes, the average value increases or decreases.
There are several types of moving averages: simple (also called arithmetic), exponential, smoothed, and weighted. Moving Averages can be calculated on any sequential data set, including open and close prices, high and low prices, trading volume, or other indicator values. Moving averages themselves are often used as well.
The only thing where the Moving Averages of the various types differ significantly from each other is the difference in the weighting coefficients assigned to the most recent data. In the case of the Simple Moving Average, all prices in the period under consideration have the same weight. Exponential and weighted moving averages (Exponential Moving Average and Weighted Linear Moving Average) make the current price more significant.
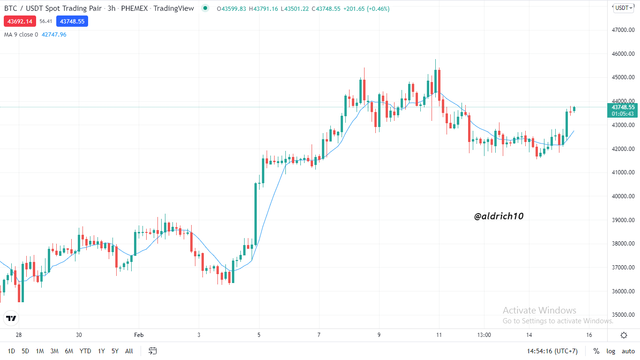
The most common method of interpreting a moving average price is to compare its dynamics with the dynamics of the price itself. When the price of the instrument rises above the Moving Average value, a buy signal appears, and when the price falls below the indicator line, a sell signal appears.
This trading system with the help of moving averages is in no way meant to ensure a tight entry into the market at its lows, and a tight exit at its peak. This allows you to act according to the current trend: to buy as soon as the price reaches the bottom, and to sell immediately after the formation of the top. At the same time, the interpretation of the moving average is similar to the interpretation of the price moving average: if the indicator rises above its Moving Average, then the indicator's upward movement will continue, and if the indicator falls below its Moving Average, this means its downward movement will continue.
There are three types of moving averages: Simple Simple Moving Average (SMA), Exponential Moving Average (EMA) and Weighted Moving Average (WMA). All of them are lagging indicators and have one goal - to determine the current trend of financial assets by smoothing out fluctuations and noise. By assessing the direction of the trend, traders can make this trend in their favor and increase the number of profitable trades.
- The simple moving average (SMA)
The simple moving average (SMA) method averages all prices from the previous period. There's no need to just use the closing price - you can set the indicator to use the opening price or even an average based on the opening, closing, high and low prices for each period. This type of moving average is the most popular.
To calculate the simple moving average is the following formula:
SMA = (Price 1 + Price 2 + ... + Price n ) n
Price and = asset price for period n
n = number of periods
- The exponential moving average (EMA)
The exponential moving average (EMA) is more suitable for trend traders because it reduces the gap between the actual price and the moving average. Therefore, traders, especially scalpers, value this indicator more, especially if it is used in combination with others, such as Bollinger Bands or Envelopes.
For the exponential moving average, the calculation formula is as follows:
EMA = Price t × k + EMA y × (1−k)
t = current time;
y = previous point in time;
N = number of days;
k = 2 (N + 1)
- weighted moving average (WMA)
Like the exponential moving average, the weighted moving average (WMA) is even more pegged to the current price. Therefore, for example, the WMA(200) will be closer to the current price than the SMA(200), as this indicator reduces the spread even more, and traders can react to price changes more quickly.
To calculate the weighted moving average is the following formula:
WMA = (Price 1 × m + Price 2 × (in 1) + ... Price n ) (n × (n + 1) 2))
n = period of time.
Difference Between SMA, EMA and WMA
| SMA | EMA | WMA |
|---|---|---|
| Shows the average closing price of the previous period | Shows the average closing price of the previous period, but the latest data is decisive in lowering the total | It also provides more decisive values for recent indicators, and lower values for past data, but for these moving averages, the formula looks a little different (see below) |
| SMA is a less sensitive moving average. Deals less damage, more suitable for beginners. Of the minuses noted by traders is a late entry into the transaction | The EMA allows you to react a little faster to price changes, but creates more noise at the entrance. It should be used by experienced traders in conjunction with other indicators | WMA should be used on a higher timeframe. Like SMA, late with trade entries. Despite its drawbacks, it combines all the best there is in simple moving averages and averages, eliminating fluctuations |
| SMA is used to smooth out minute price fluctuations and identify overall market dynamics. More often this trend analyzer is used with other oscillators to eliminate false signals | The use of EMA will allow you to avoid false signals, accurately assess the changing market situation due to greater sensitivity | WMA Focuses on price because it gives more weight to recent data and less weight to old data |
| SMA Calculations are easier to understand | EMA calculations are difficult to understand because you have to take into account data that you don't know the amount of | WMA is almost the same as EMA because it has to calculate data from previous values |
- Identifying Entry
In determining the entry point, the first thing to do is analyze the condition of the market trend, if the market condition is in a bullish signal state, then we need to set an entry point for a buy order.
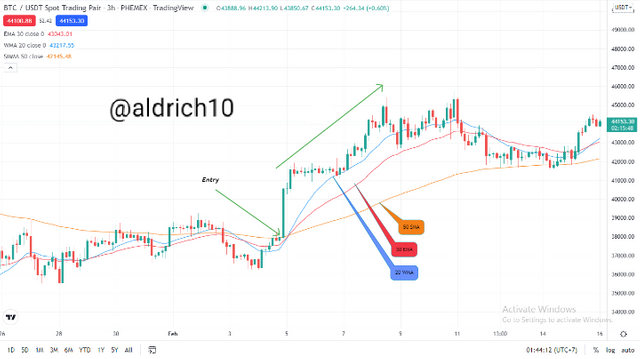
From the picture above, we can see that the trend is bullish, which is confirmed by the moving average which is moving below the market price. In this condition, we can set an entry to buy and here I also use SMA 20, EMA 30 and WMA 50 to confirm a higher entry point.
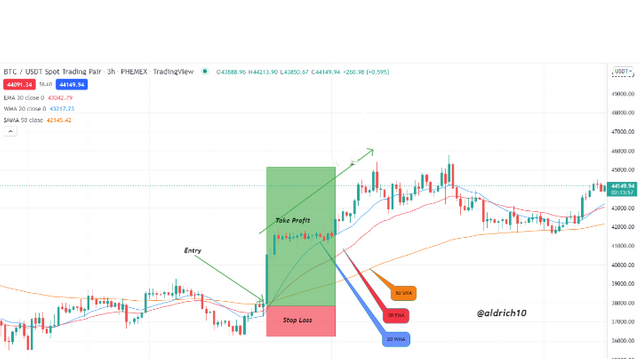
The picture above shows where I determine the entry point and place a buy order, here I also determine the ratio of my orders at 1:3 this is to anticipate if the opposite happens from our estimate.
- Identifying Exit
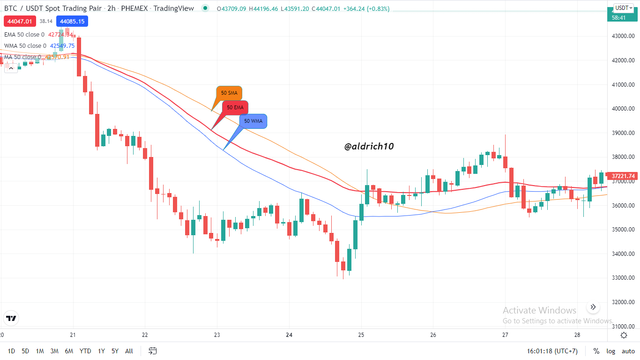
In determining the exit point or selling from the market we need to know market conditions such as the price is overbought and we can also use indicators so that we can analyze market conditions that will occur next by knowing the market movement if the next market will be bearish we can determine this exit point can save us from loss.
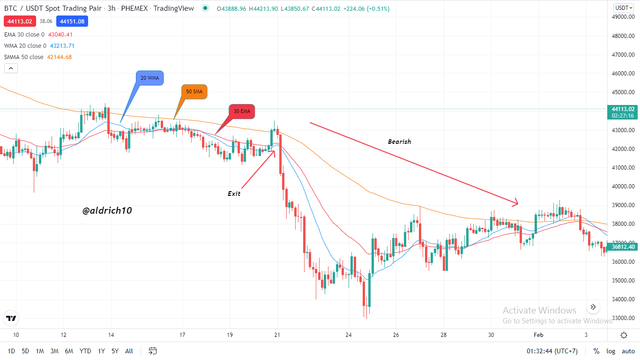
In the picture above I use the SMA, EMA and WMA indicators to detect the right exit point on the market and we can see that the right exit point because the moving average is going down is a good time to sell and make profits and also to avoid losses.
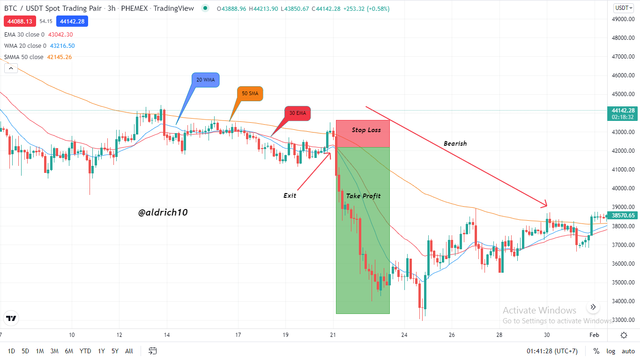
The picture above shows that the next market will be bearish, this is a perfect exit point. We can see that all indicators are showing downwards, indicating that the next market condition will be bearish.
Moving average crossover signals involve the use of more than one moving average. To get a moving average cross, we need to see that the faster moving average breaks the slower moving average. If the transition is in the bullish direction, we will get a long signal. If the transition is in a bearish direction, we get a short signal.
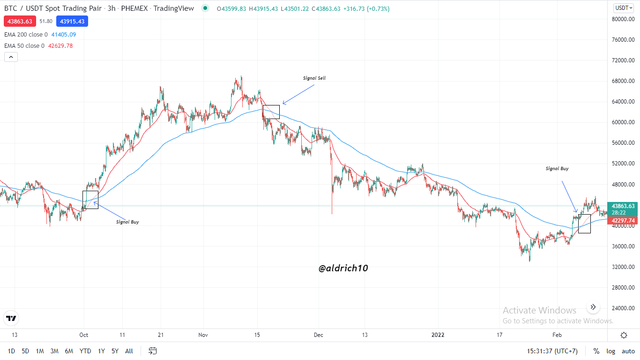
The image above shows a candlestick chart of the BTC/USDT pair from October to February 2022. The red line represents the 30 period SMA, the blue line represents the 200 period EMA. So the red line represents the 50 period EMA, where the red EMA is faster than the blue EMA, which is creates a crossover signal. We have three trend movements on the chart. For each of them, we have a moving average crossover. Blue arrows point to candles that react to the EMA crossover moment.
we can use crossover as entry point in trade. Some traders also use crossovers as exit points. However, if you want to exit the market based on the Moving Average signal, you have two other options. You can exit the trade when price breaks through the faster moving average, or when price breaks through the slower moving average. No need to wait for a crossover when exiting a trade based on your Moving Average strategy.
Certain signal delay. If the trend period is short (usually it should be twice as long as the moving average calculation period), then losses are possible.
The MA reacts to a change in the exchange rate twice: when it receives the value and when it leaves the calculation.
MA is an indicator that only works in trending markets. With a sideways trend, the number of false signals is too high.
The intersection of the two MAs serves as an effective signal, but this technique increases the delay time of the two MA from market swings, but cuts out many false signals. In order to assess the reliability of the trend crossing of the MA curve, it is a practice to wait until the trend resumes its change after a breakout by an empirically determined amount.
A moving average is a series of sequential average values with a certain smoothing period and is calculated to determine the changing trend of a random variable. In this case, the longer the smoothing period, the smoother the resulting line graph will be. This indicator is not only used as an independent technique for technical analysis, but also underlies a number of other indicators.
Moving Average shows the average price of an instrument over a certain period of time. When calculating the Moving Average, the price of the instrument is mathematically averaged over a certain period. When the price changes, the average value increases or decreases.
In addition, for more effective results, you need to study other indicators, and incorporate some of them into the trading system. Huge profits will help to bring the author's strategy, made on the basis of the experience gained. But you need to remember that trading involves significant risk of loss and is not suitable for all investors.