[Crypto Trading by Identifying Support and Resistance]-Steemit Crypto Academy | S6W3 | Homework Post for @shemul21


Support and resistance are price zones where a trend is expected to reverse or slow down before resuming the trend, and such behavior is likely to repeat itself in the future.
Support is the price zone where the downtrend is expected to reverse upwards. In this zone, buying power will dominate selling power.
Resistance is the price zone where the uptrend is expected to reverse downwards. In the reset zone, the selling power will prevail over the buying power.
When the price goes up and down, the area of the highest price before the uptrend returns is called the resistance zone
When the price is corrected down and up, the area of the lowest price before continuing the uptrend is called the support zone
Conversely, during a downtrend, support and resistance zones also form as the price fluctuates from time to time.
Resistance and support are price areas, not specific price levels. You only need to take the shadow of the candle as an area of support or resistance.
At the top, the support zone is the distance between the high and the open/close price. If the candlestick makes more resistance areas, then it is a strong resistance area, then the price will be difficult to penetrate the area.
At the bottom, resistance is the distance between the low and the open/close price. If more and more candles form a support area, then it is a strong support zone, then the price will be difficult to go down through that zone.
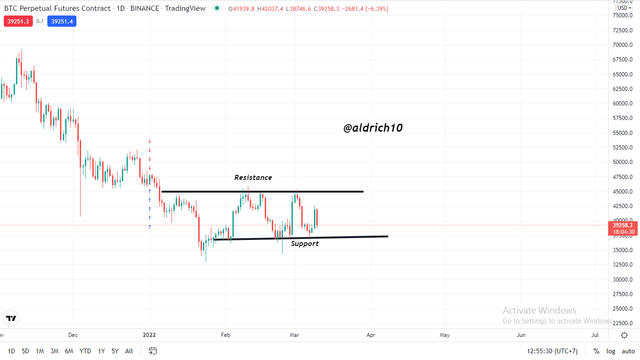
- Horizontal support and resistance levels
Horizontal resistance and support lines are one of the main concepts in financial markets. They are built very simply - it is enough to draw horizontal lines at the highs (then these lines are called resistance lines) and the lowest points (support lines) of the market in the channel. It is important to take into account the higher time frame lines.
How are these lines traded? What most people see, we see. If you are a trader, how do you use this area? For many, this is an area for placing pending orders, stop loss trigger levels, or criteria for anything else that can directly influence trading decisions (this was already mentioned in one of the posts).
It seems to me the concept of “resistance/support level” is more accurate than the concept of “resistance/support line”, because the order is not strictly on any price sign. For example, in the chart above, the line is located at the price of 96,466. however, not all traders will place their orders at this price: some a little higher, some a little lower. This should be taken into account in trading and not interfere with the proper construction of the lines themselves. Such an attitude towards the majority support/resistance lines gives us the opportunity to use them in our trading.
These levels are areas of entry into or exit from a large volume position that moves the price. Still figuring out/guessing which way the total position is bigger: sold or bought? If there are more positions to buy, then the resistance level will be broken, if there are more positions to sell, there will be a rebound. For support levels, it's the opposite. If we do not observe trading activation at this level, then this means that this line is just a line on the chart, which no one but us draws or pays attention to.
- Sloping Levels Support and Resistance (Trendlines)
It is often not possible to draw correct horizontal support or resistance lines. In this case, a sloping line of support or resistance is built. Such lines form a trend line or a price channel line.
Trend lines connect local lows or highs, which are located at different price levels. In this case, a sloping line of support or resistance of the price is formed.
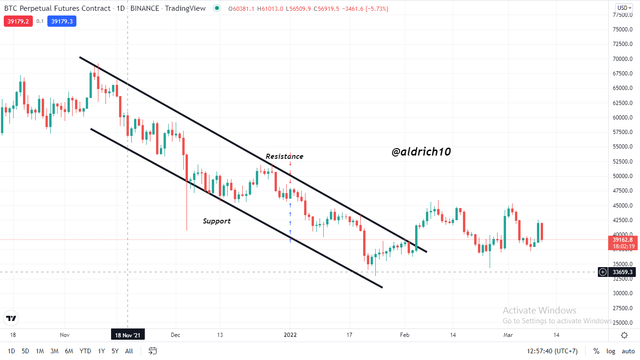
- Dynamic Support and Resistance
Another important tool that completes horizontal lines. Unlike them, in a dynamic line, it is not the price level that matters, but how this line interacts with the price.
As usual, a dynamic line is drawn based on two points, where the first point should represent a clear level of support or resistance. The second rollback forms the second point and we draw the line. Trends, as we remember, are updates from highs or lows, so it's easy to determine them with a trend line. On the 1-day chart (1D) below, two dynamic trend lines act as resistance and support.
- False Breakout
Fake acne in the market is very common. This is due to many factors. For example, they can cause fundamental changes. False details can also emerge when the fundamental background is calm. In this case, the technical factor comes to the fore.
How to explain such a phenomenon as false damage. Some experts give judgments based on the nature of the crowd behavior of the market, when some players exit a trade when a stop order is triggered and the market turns sharply in the other direction.
The Price Action technique, unlike many other trading principles, allows not only to spot false breakouts, but also to use them in working on financial markets. This strategy allows you to use the "herd mentality" of market players for the benefit of the trader and profit from it.
Before we begin to explain the principles of working with such a signal, let's define what a false break is and how to find it on the chart. It all starts with the fact that there is a certain level (support or resistance) that is blocking the price.
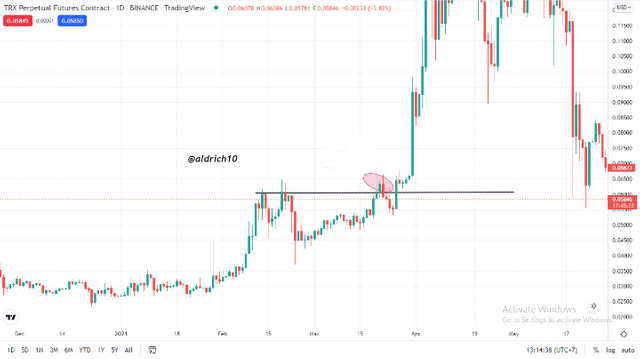
Let's see the screenshot this level is indicated by a black horizontal line, Candles (pin bars or shooting stars) are highlighted in the red column, where there was a false break of the support level. That is, the price first made a sharp jolt, and then rose again.
In practice, false breakouts can be formed not only by pin-bar candlestick patterns, but also by other candlesticks. It doesn't matter what the pattern is at such a time and whether it will happen at all. It is important that the market attempts to break above the resistance (or support, depending on the situation) and reverse in the opposite direction.
In addition, false breakouts can appear in both trending assets and in assets that are trading within a range. Therefore, it is very important to understand exactly how to work with certain currency pairs in such situations.
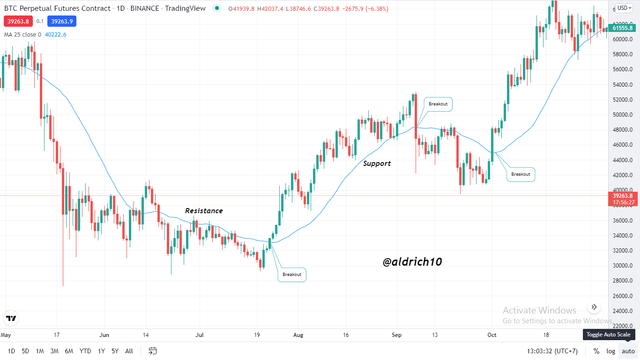
- Successful Breakouts
A real break of a support or resistance line is characterized by the fact that after crossing it, the price usually returns to this line, but from the other side. If it is a resistance line and the price breaks it, then with a local return to it, this line turns into a support line. And if this line is reliable, then the price rejects it, the so-called retest of the broken resistance line, and after that the price has fully developed in the direction of the expected growth. The same applies to the breakdown of the price support line.
A retest is the most significant criterion for a real break of a support or resistance line. After retesting, from a technical point of view, it is competent to open a position to buy or sell securities.
Examples of retest and actual break of a price resistance line:
The existence of support or resistance indicates that you are at a point where the market shows demand (support) and supply (resistance).
If the market is in an uptrend it is recommended to test the support during the correction before going back higher. in a downtrend Resistance becomes the level you want price to pull back before seeing a trend reversal lower. Convergence is the key to finding the strongest support and resistance. It can be a crossing of different levels. Horizontal levels, trend lines, slopes, Fibonacci, moving averages are just a few to mention.
When support or resistance is found It's good to see a strong reaction. It is price action confirmation indicating that market participants want prices higher or are in supply which will help push prices lower. Candlesticks are a great way to see dynamic demand/supply at work.
For example, a small reversal candle with a long tail (e.g. bullish, bearish) can be a good indicator that a reversal has followed its course. Seeing this happening at the master chart level makes this case even stronger. There are other types of candlesticks such as bullish or bearish candles. But the point is that you use price action analysis patterns in conjunction with the key support and resistance levels that you have identified on the chart.
To make it clearer, we can see in the image below :
- Buy Entry
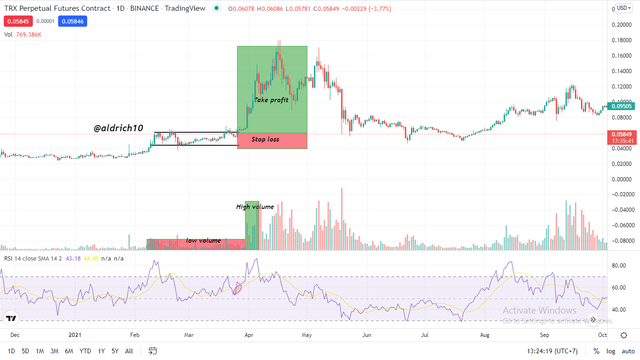
From the TRX chart above where the price broke through the resistance line and the price became bullish. pay attention to the RSI indicator which indicates that the market will be bullish. This is also confirmed by the volume indicator where the green bar is higher than before. For stop loss I set below the resistance line.
- Sell Entry
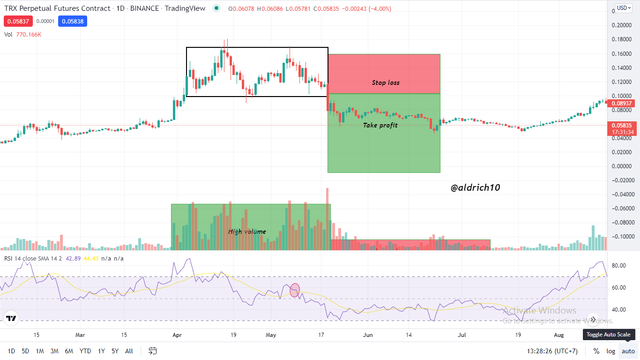
In the chart above I see a price break that occurred in TRX. The price is in a downtrend and this is also confirmed by the RSI indicator where there is a cross in the red column and also confirmed by the volume showing a red bar which indicates the market will be bearish.
In making this real trade I did it on Binance Futures and after the breakout I set an entry point to sell it.
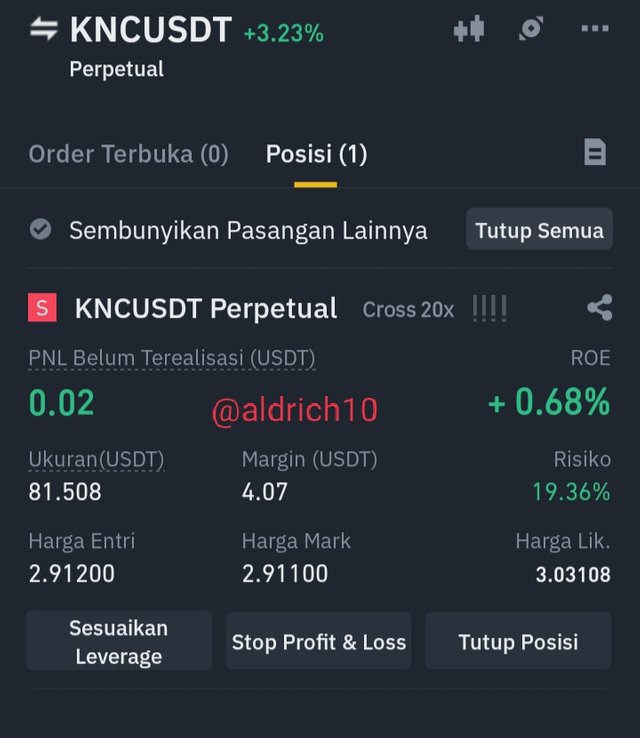
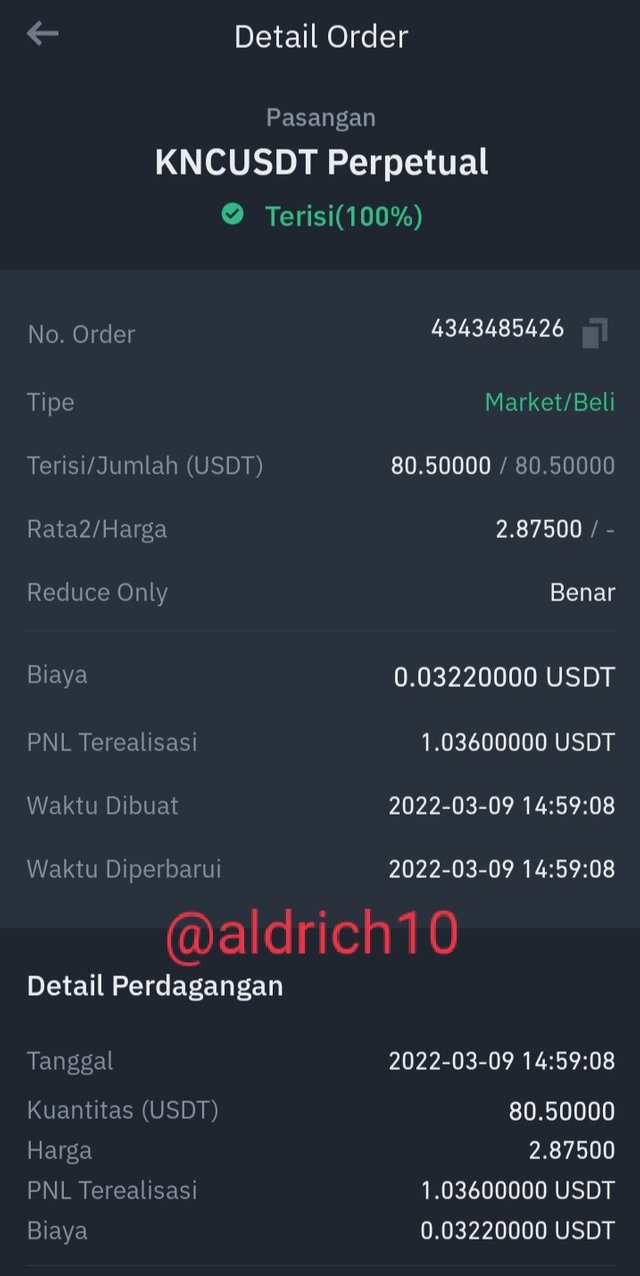
- KNC/USDT
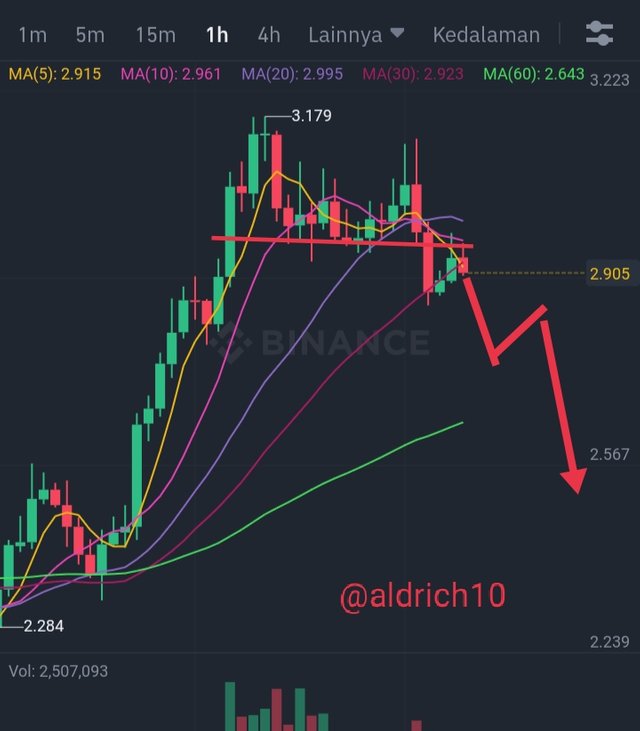
We can see in the chart above that the price touched the support level several times before the price broke it. I also use the MA indicator where the indicator line has crossed, here I determine the entry point in selling trades.
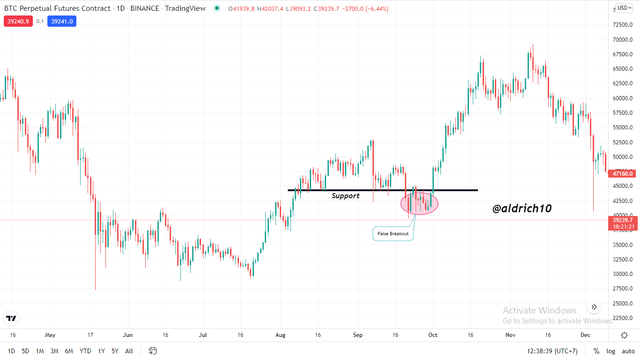
Fake pimples are a trader's nightmare. They bring losses to many. We can talk about a fake breakout when the price drops back into the range after crossing support/resistance.
To avoid losing money on fake breakouts, you need to carefully analyze the charts. Watch which trend develops when the price hits strong support or resistance.
Take a look at the example below. the price touched resistance but is still in a downtrend after that. When you see a price breakout but is still above the support/resistance (resistance in our example) it can indicate a false breakout.
Watch for a solid red candlestick breaking through the newly created support level. This indicates a downtrend and this is a good time for you to enter a short position as this is just a fake break of resistance.
Support and resistance is one of the most important concepts and forms the basis of other technical analysis tools. Support is considered the lowest area and resistance is considered the highest area where when the price tests the area it can be predicted that a reversal will occur.
Identifying support levels can help investors optimize their profits when making short-term trades, as it can help investors spot low price zones where prices may reverse. But conversely, resistance levels can also harm investors' long-term positions as they are identified as short-term highs. Investors should combine identification of support and resistance zones with other methods such as determining the general trend of the industry they hold, stock valuation, etc. to get the best results.