The Harmonic AB=CD Pattern + Fibonacci - Crypto Academy / S4W2 - Homework Post for Professor @lenonmc21

Good night everyone, steemians, blogers, readers, and crypto lovers. I will start a positive activity today because life must always be productive and today I will write a post about cryptocurrency on my blog to participate in the Steemit Crypto Academy Season 4. This is the second week of Season 4 and the second class I will be taking this week is professor @lenonmc21's class. In this class, we will learn and share knowledge about "The Harmonic AB=CD Pattern + Fibonacci" based on the following questions.
Question 1:
Explain in your own words what is Harmonic Trading

Harmonic Trading is a pattern of price movements that tends to repeat itself because in general the current conditions have occurred in the past and current conditions have the potential to repeat itself in the future. Overall, the law of supply & demand plays a big role in the market and generally the market cycle will tend to repeat itself like a loop system because market psychology also plays a big role here.
Harmonic Trading is one of the things that is considered in technical analysis, especially in identifying patterns that are formed in the market based on the visual appearance found on the price chart. In Harmonic Trading, traders can identify a number of points on the price chart pattern using the help of Fibonacci Retracements Levels. That way, traders can determine the entry and exit points better even though it can't be said to be 100% accurate, therefore traders also need to determine the SL:TP ratio by determining the stop loss and take profit points.
Harmonic Pattern Categories:

There are several types of Harmonic Patterns and in this topic we will only discuss the AB=CD Pattern, let's learn about it.

Question 2:
Define and Explain what the AB=CD pattern is and how to identify it

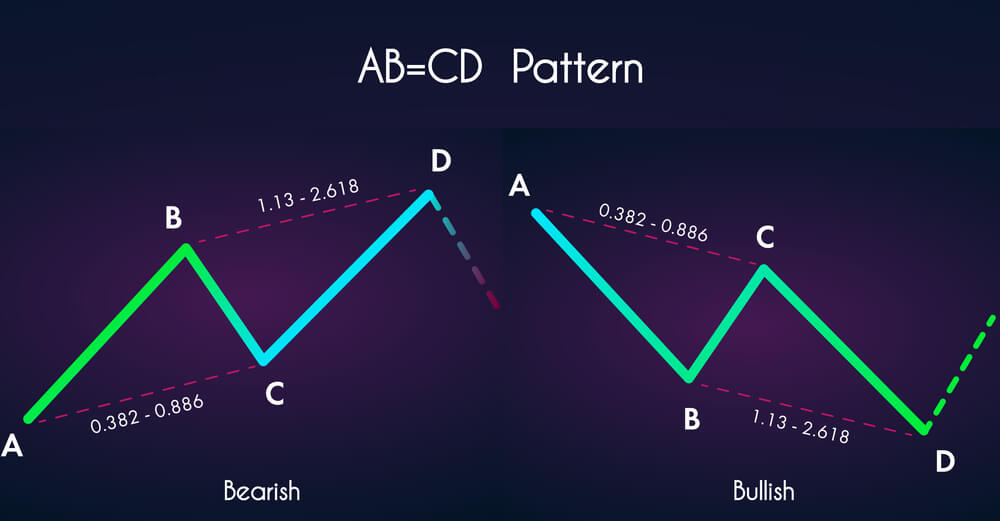
As the name suggests, the Harmonic AB=CD Pattern consists of four points that make up the three main wave lines. These points consist of A, B, C, D and to verify it, these points can be reflected against the values contained in the Fibonacci Retracements while the three wave lines formed from these four points are lines AB, BC, and CD. Based on its characteristics, the length of the AB line tends to be almost the same as the length of the CD line.
AB=CD Pattern is distinguished by two types of market conditions, namely Bullish and Bearish. When the price chart shows AB=CD Bullish Pattern then traders can consider placing a Buy Order because the asset price has the potential to go up and when the price chart shows AB=CD Bearish Pattern then traders can consider placing a Sell Order because the asset price has the potential to go down. To be clear, traders need to identify the two categories directly and here is some illustrations.
AB=CD Bullish

In this case traders can identify potential upward price movements that will occur next when the price is down and this is done by determining points A, B, C, and D when the price is down and then reflecting it against the values contained in the Fibonacci Retracements. Here are three main conditions that need to be considered and must be met.
- Along AB line, there is no candle that goes beyond point A or point B.
- Point C should be at a position lower than point A and be between 61.8% & 78.6% Fibonacci Retracements of AB line.

- Point D should be between 127.2% & 161.8% Fibonacci Retracements of the BC line.

AB=CD Bearish

In this case, traders can identify potential downward price movements that will occur next when prices are rising and this is done by determining points A, B, C, and D on rising prices and then reflecting them against the values contained in Fibonacci Retracements. Here are three main conditions that need to be considered and must be met.
- Along AB line, there is no candle that goes beyond point A or point B.
- Point C should be at a higher position than point A and be between 61.8% & 78.6% Fibonacci Retracements of AB line.

- Point D should be between 127.2% & 161.8% Fibonacci Retracements of the BC line.

Question 3:
Explain clearly the entry and exit criteria, is it good for buying and selling using the AB=CD pattern
Entry Criteria (Buy and Sell)
- Identify points A, B, C, and D correctly.
- Make sure that point C is between 61.8% & 78.6% Fibonacci Retracements.
- Make sure that point D is between 127.2% & 161.8% Fibonacci Retracements.
- Traders can decide to enter if a bearish candle occurs at point D because this condition tends to have considerable potential.
Exit Criteria (Buy and Sell)
- Determine the Stop Loss point, preferably about 2% from the entry point, namely point D.
- Determine the Take Profit point, the SL:TP ratio should be 1:1, but you can also use 1:2 or 1:3.
- For the 1:1 case, the Take Profit point is also 2% from the entry point.
Question 4:
Make 2 entries (Up and Down) on any cryptocurrency pair using the AB=CD pattern confirming it with Fibonacci
After confirming it with Fibonacci as seen in the price chart pictures that I have shown in the previous questions, I will answer this question with the same price charts and here is the continuation.
For Case 1:

For Case 2:

Based on the two pictures above, it can be concluded that both trade orders were executed on Take Profit.
Conclusions
The pattern of price movements that occur in the market tends to repeat itself and this is related to market psychology factors and the law of supply & demand. Therefore, Harmonic Trading is one of the things considered in technical analysis, especially in identifying patterns that form in the market.
In this case, Fibonacci is used to identify a number of points on the price chart pattern so that traders can better determine entry and exit points even though it is by no means 100% accurate, and don't forget to use Stop Loss in each of your trades. In this class I have learned about the AB=CD Pattern combined with Fibonacci, thank you professor @lenonmc21 for providing a very interesting learning topic and this is a new knowledge for me.