How to Trade Cryptocurrencies Profitably Using TD Sequential - Crypto Academy / S4W8 - Homework Post for Professor @reddileep

Good night everyone, steemians, blogers, readers, and crypto lovers. I will start a positive activity tonight because life must always be productive and tonight I will write a post about cryptocurrency on my blog to participate in the Steemit Crypto Academy Season 4. This is week 8 of Season 4 and the second class I will be taking follow this week is professor @reddileep's class. In this class, we will learn and share knowledge about “How to Trade Cryptocurrencies Profitably Using TD Sequential” based on the following questions.
Question 1:
Define TD Sequential Indicator in your own words
TD Sequential is one of the technical indicators that traders can use to predict the market and help them in making trading decisions. This indicator was created by Tom DeMark with the aim of helping traders predict the market so that traders can take maximum profit. The cryptocurrency market is highly volatile and market movements are always changing, both in the long term and in the short term.
Long-term changes are usually referred to as reversal while temporary changes in the short term are usually referred to as corrections. When the market has been moving too long in a certain direction then it indicates that the market may have the potential to experience Correction or Reversal. And traders can use the TD Sequential indicator to identify markets based on these two conditions in particular. Based on its use, to get better accuracy, the TD Sequential indicator should use a price chart with Japanese Candlesticks and Analyst Timeframes that tend to be higher, such as 4 Hours and 1 Day. In addition, the TD Sequential indicator also tends to not work when used in very strong market conditions and because no indicator is 100% accurate, traders should also not rely on any one indicator.

Question 2:
Explain the Psychology behind TD Sequential. (Screenshots required)
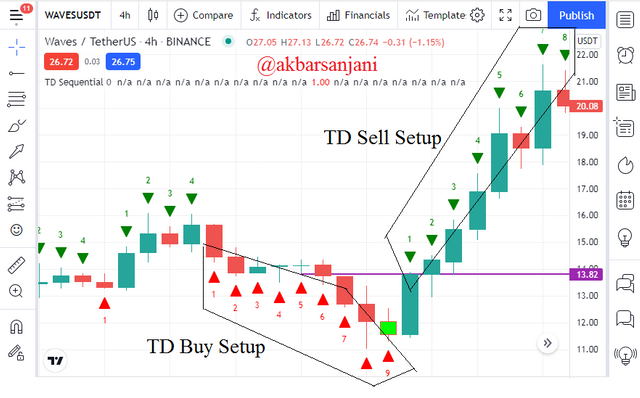
In general, TD Sequential consists of two phases, namely TD Setup and TD Countdown. The main difference between the two phases is the provision of the number of counts considered in the analysis, TD Setup usually uses 8 or 9 counts whereas TD Countdown uses up to 13 counts.
But in this lesson we will focus on TD Setup. The TD Sequential Indicator displays a number of numbers at the top or bottom of the candles and these numbers correspond to two types of TD Setups, namely TD Buy Setup which applies to downtrend market conditions and TD Sell Setup which applies to uptrend market conditions because the basic principle of trading is buy low and sell high. Visually, the red numbers at the bottom of the candle indicate the TD Buy Setup while the green numbers at the top of the candles indicate the TD Sell Setup.
When the TD Buy Setup shows up to 8 or 9 counts then it means that the seller is very dominant in controlling the market and the amount of supply is greater than the number of demands while when the TD Sell Setup shows up to 8 or 9 counts then it means that the buyers are very dominant in controlling the market and the quantity demanded is greater than the quantity supplied. And if one of the two succeeds in taking over market dominance, a reversal or correction will occur.
Question 3:
Explain the TD Setup during a bullish and a bearish market. (Screenshots required)
A. TD Buy Setup
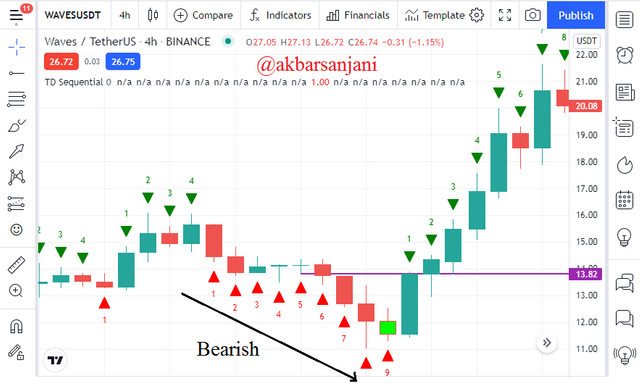
In the picture it can be seen that the market experienced a significant decline and even the TD Buy Setup showed up to 9 counts which means that the seller is very dominant in controlling the market and the amount of supply is greater than the number of requests. This also indicates that the market has moved too long and more than it should, so it has the potential to experience a reversal or correction.
In the picture it can also be seen that the closing point of the first bullish candle that appears after the ninth candle is also above the closing point of the previous 4 candles as I marked with a purple horizontal line. The graph also proves that the TD Buy Setup ended after the formation of the eighth and ninth numbers, then the market turned out to be experiencing a reversal from Bearish to Bullish which means that buyers managed to take over market dominance and make demand greater than supply. As a good consideration, traders should enter the market to place Buy Orders after the close of the ninth TD Buy Setup and of course with proper stop loss use.
B. TD Sell Setup
In the picture it can be seen that the market is experiencing a significant increase and even the TD Sell Setup shows up to 9 counts which means that buyers are very dominant in controlling the market and the number of demands is greater than the number of supplies. This also indicates that the market has moved too long and more than it should, so it has the potential to experience a reversal or correction.
In the picture it can also be seen that the closing point of the first bearish candle that appears after the ninth candle is also below the closing point of the previous 4 candles as I marked with a purple horizontal line. The graph also proves that the TD Sell Setup ended after the formation of the eighth and ninth numbers, then the market turned out to be experiencing a reversal from Bullish to Bearish, which means that the sellers managed to take over market dominance and make the supply bigger than the demand. As a good consideration, traders should place a Sell Order after the closing of the ninth TD Sell Setup to get some profit and of course with a good stop loss.
Question 4:
Graphically explain how to identify a trend reversal using TD Sequential Indicator in a chart. (Screenshots required)
A. Bearish to Bullish
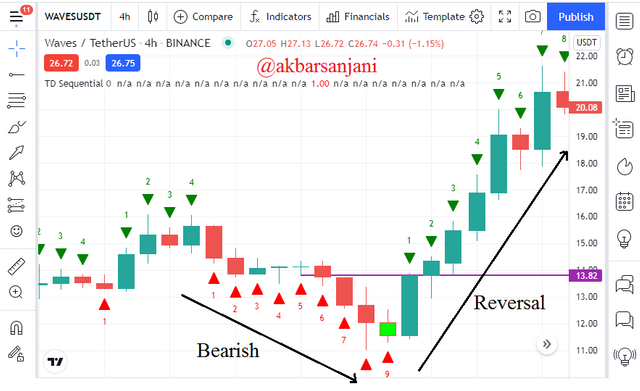
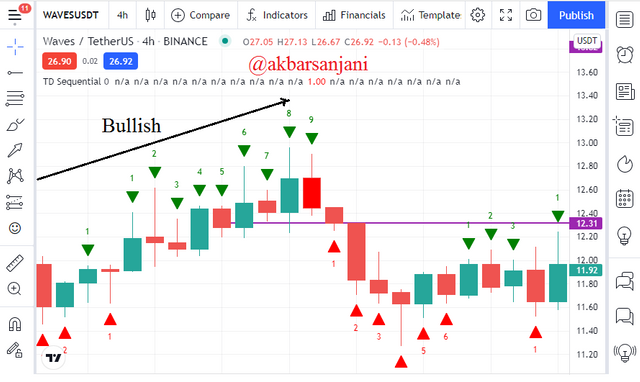
Here I use the 4 Hours timeframe and in the picture it can be seen that the ninth TD Buy Setup has been successfully formed. The ninth TD Buy Setup closing point is also lower than the sixth and seventh TD Buy Setup closing points. The closing point of the eighth TD Buy Setup is also lower than the closing points of the sixth and seventh TD Buy Setup. While the closing point of the ninth TD Buy Setup is also slightly below the closing point of the eighth TD Buy Setup and this shows that this formation is perfect. In the picture it can also be seen that the closing point of the first bullish candle that appears after the ninth candle is also above the closing point of the previous 4 candles as I marked with a purple horizontal line. And the reversal from Bearish to Bullish finally actually happened, as seen in the picture.
B. Bullish to Bearish
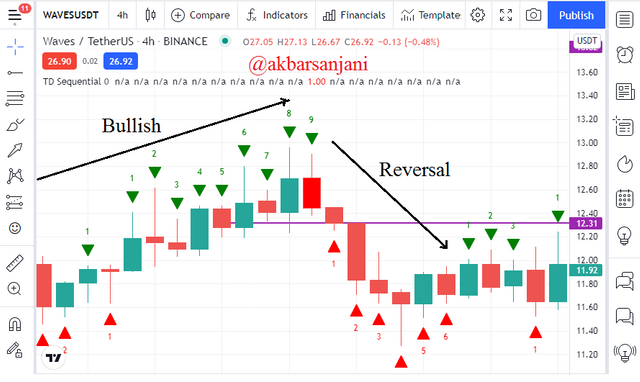
Here I use the 4 Hours timeframe and in the picture it can be seen that the ninth TD Sell Setup has been successfully formed. The ninth TD Sell Setup closing point was also slightly higher than the sixth and seventh TD Sell Setup closing points. The closing point of the eighth TD Sell Setup is also higher than the closing point of the sixth and seventh TD Sell Setup. While the closing point of the ninth TD Sell Setup is also below the closing point of the eighth TD Sell Setup and this shows that this formation is not perfect but has met the requirements based on the eighth TD Sell Setup. In the picture it can also be seen that the closing point of the first bearish candle that appears after the ninth candle is also below the closing point of the previous 4 candles as I marked with a purple horizontal line. And the reversal from Bullish to Bearish finally actually happened, as seen in the picture.
Question 5:
Using the knowledge gained from previous lessons, do a better Technical Analysis combining TD Sequential Indicator and make a real purchase of a coin at a point in which TD 9 or 8 count occurs. Then sell it before the next resistance line. (You should demonstrate all the relevant details including entry point, exit point, resistance lines, support lines or any other trading pattern such as Double bottom, Falling wedge and Inverse Head and Shoulders patterns)
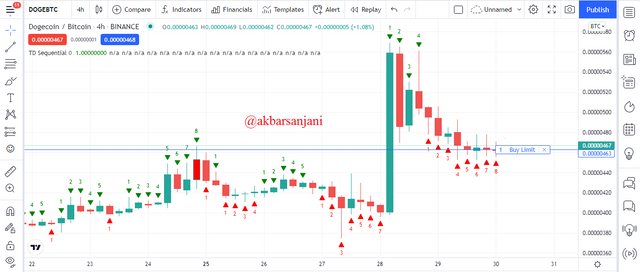
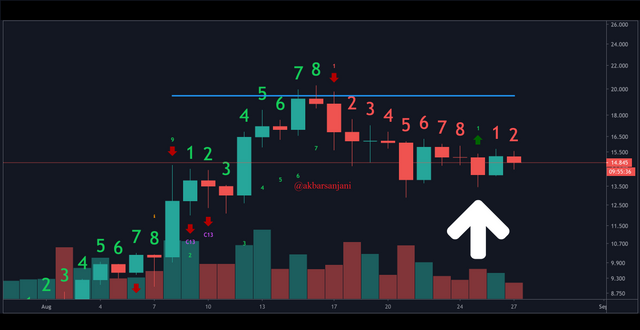
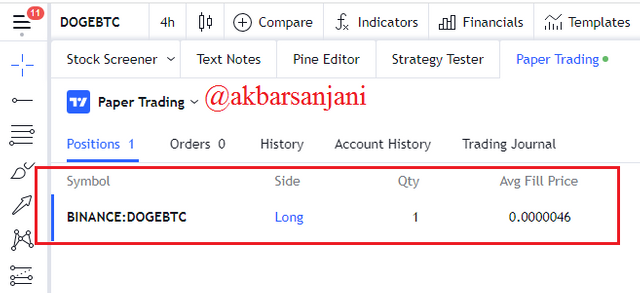
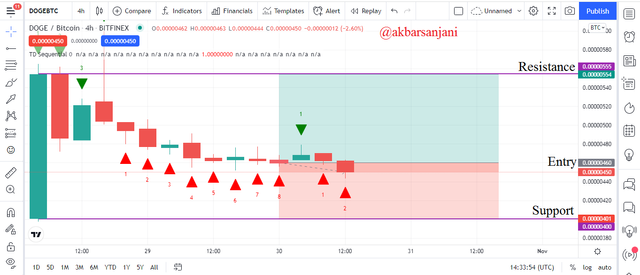
In the picture it can be seen that the eighth TD Buy Setup has been formed on the DOGE/BTC trading pair with a timeframe of 4 Hours and it can be seen that the market is moving down significantly after a significant surge some time ago. I decided to place a Long Position at the close of the eighth TD Buy Setup candle and I managed to buy DOGE. Here is the simulated proof.
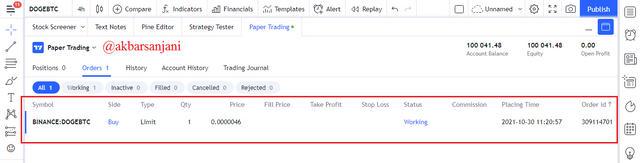
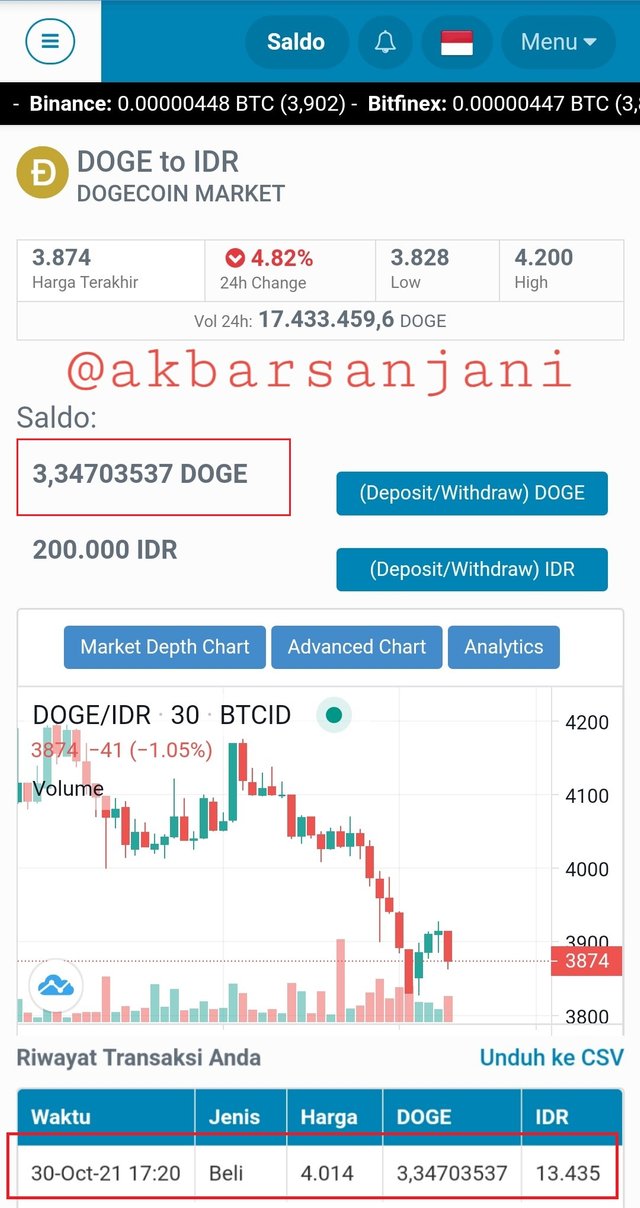
Meanwhile, here is concrete evidence that I have purchased a certain amount of DOGE on my verified trading account on the Indodax platform.
With good trade management, I set a stop loss with a ratio of 1:1.5 based on the resistance and support points that I have determined, and until now my trading process has not hit the take profit point or the stop loss point because it is still ongoing. I set a support point and a resistance point on the same candle because the candle is a giant bullish candle that makes a strong swing high and a strong swing low in this case. Here are my trading operations for now.
Conclusions
TD Sequential is one of the technical indicators that can be used by traders to predict the market and help them in making trading decisions so that traders can take maximum profit because the cryptocurrency market is very volatile and market movements are always changing, both in the long term and in the long term. short. When the market has been moving too long in a certain direction then it indicates that the market may have the potential to experience Correction or Reversal.
To get better accuracy, the TD Sequential indicator should use a price chart with Japanese Candlesticks and a minimum Timeframe of 4 Hours. The TD Sequential indicator also tends to malfunction when used in very strong market conditions and since no technical indicator is 100% accurate it is best not to rely on any one indicator alone. Traders can combine several indicators according to their strategy and always use a stop loss in every trading operation.

#club5050 😀