Trading Using Rectangular Pattern-Steemit Crypto Academy -s5W4- Homework post for @sachin08

Explain Rectangle Pattern in your own word.
Till now we have read different chart patterns to carry out our technical analysis of crypto markets one of the many chart patterns to consider to earn maximum profits is the rectangle chart pattern. To know more continue reading.
Rectangular Pattern
A rectangle pattern is one of the ranging market patterns that indicate trend continuation or reversal formed with the help of two or continuous support and resistance level of price chart of an asset. Once the trend breaks out after the formation of the pattern the price is likely to continue its movement in the direction trend had before the formation of the trend. Another thing I’d like to mention of this pattern the volume seems to decrease when this trend is formed and once the price breaks out the trend volume rises back.
It is called rectangle pattern because the trend is likely to shape or identify by drawing trendline above and below the equal support and resistance levels i.e. making it ranging market. Furthermore, the Rectangle pattern comprises two types namely known as rectangle tops or rectangle bottoms that we will be discussing in another question of this assignment post.
The breakout of this trend indicates the end of a trend and tells the direction price is aiming to move the price can continue with the previous trend or there can be chances of a trend reversal. The best time to enter using this pattern for traders to buy or sell is once the trend breaks out i.e. either in a bullish or bearish direction.

How to identify Rectangles. Explain with Screenshots
As we have studied different chart patterns and for the bullish movement we know the price moves in such a way that each resistance and support level is higher than the previous one support and resistance level meanwhile for bullish each support and resistance level must be lower than previous ones however rectangle is identified when the support and resistance levels are equal to previous support resistance levels.
Now for practical demonstration, we can have a look at the screenshot of the chart of BTCUSDT trading pair where we can see the market trend of the bearish market however at the time we reached a point where the new resistant line wasn’t lower than the previous but instead, the price meets the rejection at a point similar to previous rejection hence and same goes with support line so once we start to draw a trendline on resistance and support level a rectangle pattern can be identified as we can see in these case the trend continued.
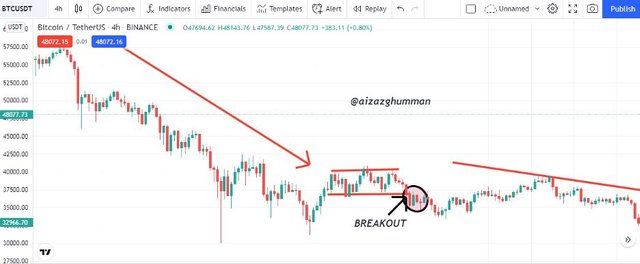
In short, a rectangle pattern can be identified when the market is ranging and the new resistance and support levels are equal to previous ones.

Can we use indicators with this pattern to get accurate results? Explain with Screenshots
About getting accurate answers I’d say one cannot completely rely on indicators and chart patterns for trading considering the volatility of crypto markets hence one cannot be sure what market has next to come for traders however to get the possible most accurate result it is preferable to add indicators along with reading chart patterns.
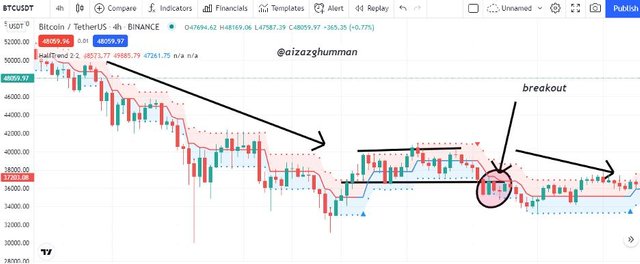
For explanation, I’d like to use a sample of trading pair BTCUSDT and once I was able to identify rectangular pattern the I added a technical indicator that in this case is “Half trend” indicator as we can see in the chart below once the crossed the chart pattern the line of the indicator turned red indicating the market to be bearish.

Explain Rectangle Tops and Rectangle Bottoms in your own words with Screenshots
As we discussed in question number 1 of this task rectangular pattern is further divided into two types on if that is rectangular tops so as the name implies these patterns are observed at the top of the chart and are found after bullish market trend. Since the trend is formed at the top so these trends are likely to break out from the support level however one cannot be 100% sure as the trend can further continue to be bullish.
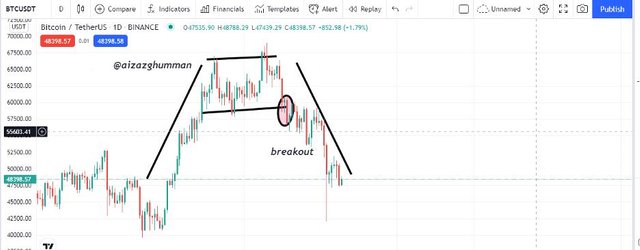
The chart above shows rectangular top being identified on the chart of trading pair BTCUSDT that shows the market reversed after the formation of rectangular top breakout.
Rectangular Bottoms
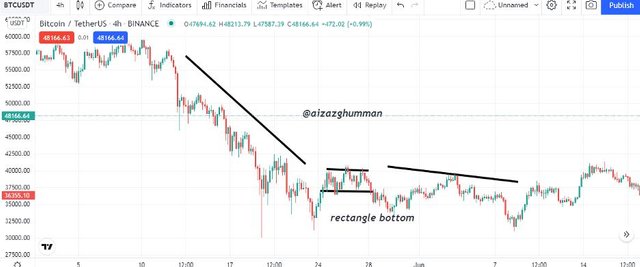
t is another type of rectangular pattern and similar to what its names suggest it is found at the bottom of the chart and usually detected after a bearish trend since it’s already at the bottom then once the price breaks out the market is predicted to reverse i.e. bullish after the breakout from resistance level however one cannot be sure.
The chart below represents the price chart of trading pair BTCUSDT it can be seen a rectangular bottom is identified at the bottom of the chart and the price after breakout turned bearish i.e. market continued.

Show full trade setup using this pattern for both trends. (Entry Point, Take Profit, Stop Loss, Breakout)
Sell setup for Rectangular Pattern
The chart below shows the representation of the rectangular pattern being identified in the chart pattern of trading pair BTCUSDT
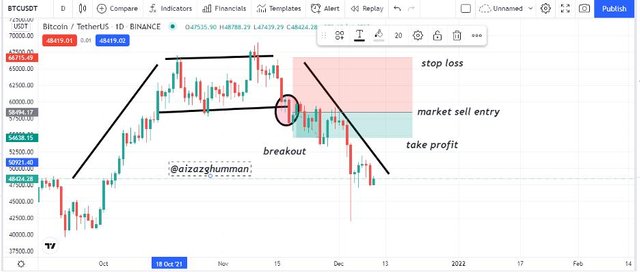
As you can see once the price passed through the trend breakout occurred from support level where I placed my market sell entry now moving further to create a setup I place my take profit value slightly below the last support level and market my stop loss above the last resistance level.
Buy Setup For Rectangular Pattern
The chart below shows the representation of the rectangular pattern being identified in the chart pattern of trading pair BTCUSDT.
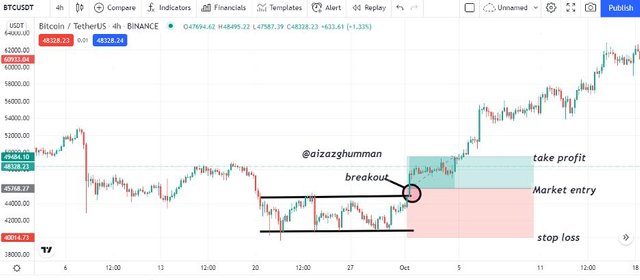
As you can see once the price passed through the trend breakout occurred at resistance level indicating an uptrend where I placed my market buy entry now for trade setup I placed my stop loss value slightly below the last support level and marked my take profit above the last resistance level.

Conclusion
Rectangular patterns though are hard to crack on charts but still easy to predict price movement. These patterns are commonly known as trend continuation patterns, however, can also be seen being used to identify market reversal. Using technical indicators along with this pattern can help traders to get more accurate results.
Lastly, I really would want to mention the lecture being a real help to understand these patterns so much appreciation to the professor for his efforts in this task hope I met his expectations for the chart.