Steemit Crypto Academy Season 5 Week 5 [Beginner's Course] - Trading Using Wedge Pattern
Let's start it.
Introduction:
We have read multiple things on charts and their pattern in previous assignments so adding we are quite familiar with the term chart pattern however in this assignment we will be talking about a new pattern that is “wedge pattern”.
1. Explain Wedge Pattern in your word.
WEDGE PATTERN:
The wedge pattern is one of the reversal patterns however also helps to identify trend continuation (if it’s in the middle of trend) and easiest most to read if detected perfectly. So as the name implies these patterns are wedge-shaped and when detected the price trend is likely to reverse and as we know there are two types of trend i.e. bullish and bearish so the wedge patterns comprised of two types are called “Falling” and “Rising” pattern that we will be discussing in the second question of this homework post.
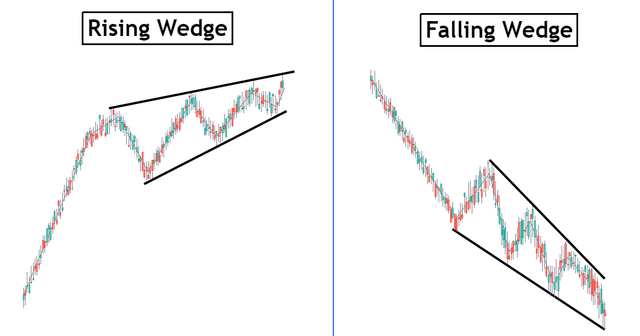
The trend is formed with the help of two trend lines i.e. supporting and resistant wedge. These two lines start forming with the broad distance between them but gradually the distance decreases and the other end of these two lines come close shaping a wedge hence called a wedge pattern. This pattern is formed when the price retraces at the boundaries of trend lines and eventually breaks out the trend.
2. Explain both types of Wedges and How to identify them in detail. (Screenshots required)
As we discussed in the question above the wedges are of two types so here we’ll be talking about those types and their identification in the chart.
Rising Wedge and Its Identification:
The rising wedge pattern can be understood through its name itself that the when price chart forms wedge-shaped chart with price increasing (rising) upwards hence that wedge is called rising wedge. These wedges when formed give hints of an upcoming bearish trend. The rising wedge is formed when the wedge starts forming between support and resistance lines and these lines start coming closer (shaping it wedge) at the top or high position of price so named rising wedge. The rising wedge can start forming in any of the trending markets i.e. uptrend or downtrend.
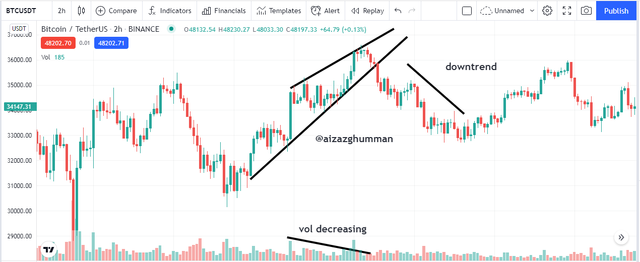
Now here’s how you can identify the rising wedge on the chart.
In the lecture the professor explained certain parameters to match to identify the rising wedge that is as follows:
First, we’ll be drawing supporting and resistant wedges lines at their designated place and should be beginning from the point where the wedge pattern starts forming and ends on with the price moving upward and the lines should be fulfilling the criteria of an upward slope.
The next thing after drawing supporting and resisting wedges the analyzers should do is to see that at least at 5 places these support and resistant wedges three at resistant and 2 at support level or vice versa.
Now the final thing to identify that can help traders is to verify that the volume is decreasing downward during the trend formed and at break out the volume may be high or usually, it’s below the average.
The screenshot below shows the identification of the rising wedge.
Falling Wedge and Its Identification:
The falling wedge pattern again can be understood through its name itself that the when price chart forms wedge-shaped chart with price decreasing (falling) downwards hence that wedge is called falling wedge. These wedges when formed give hints of the upcoming bullish trend. The falling wedge is formed when the wedge starts forming between support and resistance lines and these lines start coming closer (shaping it wedge) at the down or low position of the price chart so named falling wedge. The falling wedge can start forming in any of the trending markets i.e. uptrend or downtrend.
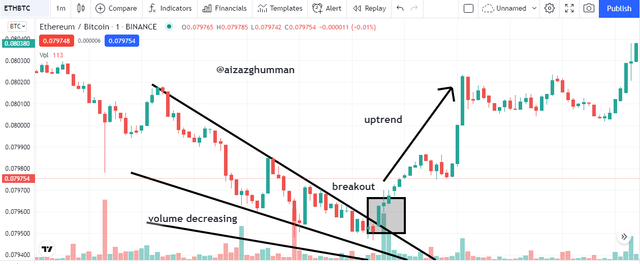
Now here’s how you can identify the falling wedge on the chart.
In the lecture the professor explained certain parameters to match to identify the falling wedge that is as follows:
First, we’ll be drawing supporting and resistant wedges lines at their designated place and should be beginning from the point where the wedge pattern starts forming and ends on with the price moving downward and the lines should be fulfilling the criteria of a downward slope.
The next thing after drawing supporting and resisting wedges the analyzers should do is to see that at least at 5 places these support and resistant wedges three at resistant and 2 at support level or vice versa.
Now the final thing to identify that can help traders is to verify that the volume is decreasing downward during the trend formed and at break out the volume may be high or usually, it’s below the average.
The screenshot below shows the identification of a falling wedge.
3. Do the breakout of these Wedge Patterns produce False Signals sometimes? If yes, then explain how to filter out these false signals.
The answer to the first part of this question is “YES” the breakout of these can produce false signal believing in how volatile crypto markets are so one cannot rely on chart patterns 100% so a good trader never trades by analysis chart pattern alone however to make more accurate technical a trader makes use of technical indicators too along with chart patterns to verify the chart pattern.
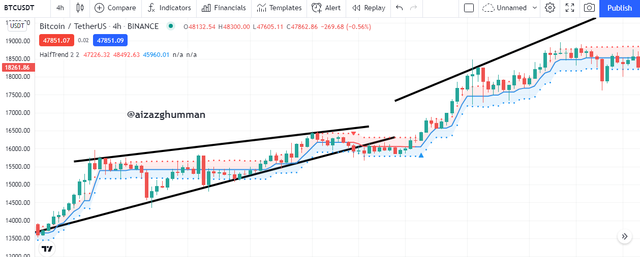
so to understand this better let's do a practical demonstration in the chart below you can see we have applied a technical indicator that is a half trend in this case so this indicator works in a way that when the indicators show a blue line it means bullish trend and when red it means bearish trend so as we can see in the chart below we identified the wedge pattern and the confirmed the trend reversal by showing blue line indicating bearish or bullish trend hence trader can confirm that trend is not giving out false signals.
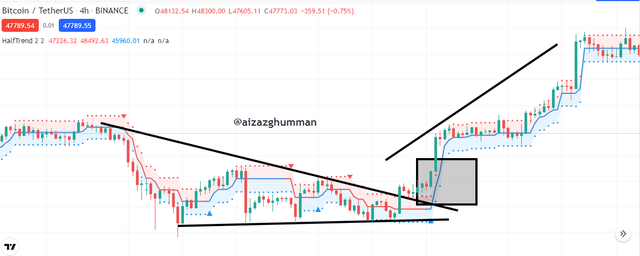
However, now we can see the example of false signals identified with the help of indicators in the chart below
You can see we have applied a technical indicator that is a half trend in this case so as we can see in the chart below we identified the wedge pattern and showed it as fake signals of the trend reversal byline indicating a bullish trend hence traders can confirm that trend is giving out false signals.
4. Show full trade setup using this pattern for both types of Wedges. (Entry Point, Take Profit, Stop Loss, Breakout)
Now for trade set up for rising wedge can be seen in the picture below on chart of trading pair BTCUSDT as we can see when the wedge pattern is formed and trend breaks out from below
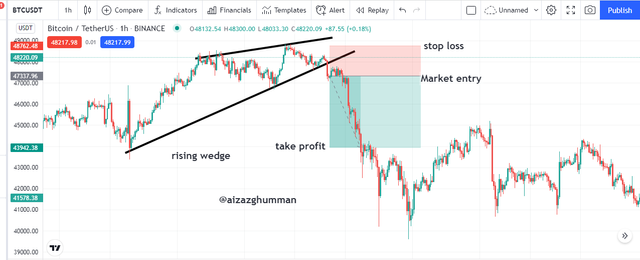
So once it crossed the support line a trend reversal is expected so I placed my sell entry there and set my take profit and stop loss value as shown. My stop loss was slightly above the resistance level and take profit was measured by calculating the distance between the widest distance of wedge patterns.
Now for trade set up for falling wedge can be seen in the picture below on chart of trading pair BTCUSDT as we can see when the wedge pattern is formed and trend breaks out from top i.e. resistant line
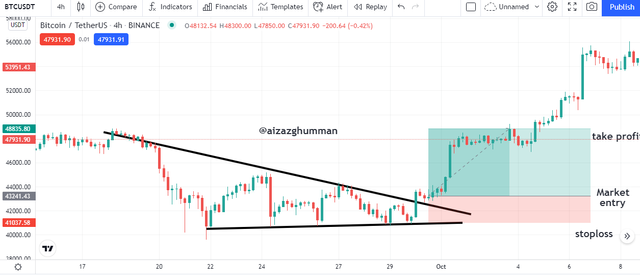
So once it crossed the resistant line a trend reversal is expected so I placed my sell entry there and set my take profit and stop loss value as shown. My stop loss was slightly above the support line and take profit was measured by calculating the distance between the widest distance of wedge patterns.
Conclusion
The wedge pattern is among the easiest most reversal patterns and can be very helpful if detected properly and can help traders earn maximum profits and also helps traders to enter or exit at right time. However, no strategy gives out 100% accurate results based on analysis. So one must be aware of the risk management idea. The wedge pattern is of two types and can help traders to detect trend continuation or reversals. One must be having good knowledge of this trend before using it to trade. Thanks to the professor for the lecture that made the assignment easier hope I met his expectations for the assignment. Thank you