Steemit Crypto Academy Season 5 Week 3 [Beginner's Course] - Understanding Trends II

- a) Explain your Understanding of Trend Reversal. What is the benefit of identifying reversal patterns in the Market?
b) How can a fake reversal signal be avoided in the market? (Screenshot needed).
(a)Trend Reversal
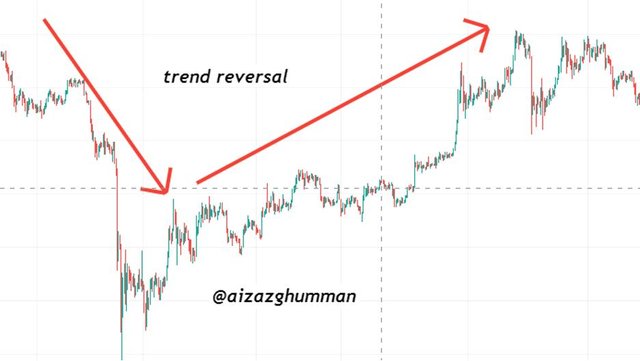
A trend is said to be the direction of movement of asset price its either increasing or decreasing i.e. going up or falling down these two directions are called uptrend or downtrend now when these two directions switch it is said to be trend reversal or simply said the change of direction of the price of an asset. Different chart patterns can help to identify upcoming trend reversals some of which we will be covering in the second question of this assignment post let’s just stick to my understanding of trend reversals. A trend reversal is when uptrend shifts to a downtrend or vice versa occur when the trend lacks potential to continue further i.e. both buyers and sellers have dominance being switched between them.
For someone who’s into trading must have been aware of these trend reversals to yield maximum profits or to prevent themself from losses by placing their buy or sell order on right time let’s study the pros of understanding trend reversal strategy
Perks of Identifying reversal patterns
Identifying these trend reversals can help traders to prevent loss for example a trader who bought an asset that had been trending upward for a while but now he can identify an upcoming downtrend of that asset then he can sell off his asset early when he’d see the price going down that would protect him from earning loss.
Another advantage we get by identifying these trend reversals is we can yield maximum profits through them let’s understand through an example: A trader who sees an asset price moving downwards or bearish but detects trend reversal he upon confirmation of that trend reversal can immediately make a purchase of that asset by placing buy order and can sell off when the price reaches the peak of that asset that would get him maximum profit.
(b)Avoiding Fake Reversal Signals
First and foremost let us know there are possibilities of fake signals in any chart pattern either we predict trend continuation or trend reversal pattern we can come across fake signals in any of these patterns and there’s no way through which we can avoid these fake signals or trend reversal or even continuation 100% however here’s how we can reduce the chances to a minimum to get distracted by fake reversal.
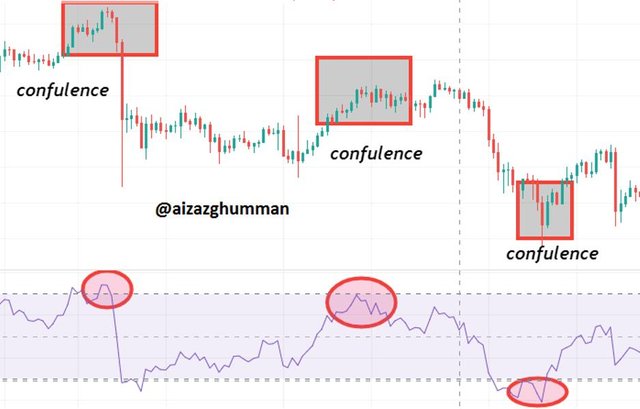
CONFLUENCE (USING TECHNICAL INDICATOR)
Nowadays traders optimize technical analysis of indicators using technical indicators along with reading chart patterns and one of the most popular and used methods to avoid fake trend reversal signal by finding confluence “a point of agreement” between indicator and chart pattern which confirms the reversal trend to the user as there can be times where we might detect trend reversal pattern but the price won’t reverse or it could be retracement hence one can avoid fake signal by confirming it through different technical indicators.
OBSERVING UPCOMING CANDLES AFTER TREND REVERSAL DETECTION
Another way traders can avoid being trapped by these fake signals is by waiting for the next view candle and observing their direction if they indicate reversal then the trader can execute his position accordingly if the trend doesn’t reverse then it can save you from taking a wrong decision in the meantime.

Give a detailed explanation on the following Trend reversal identification and back up your explanation using the original chart. Do this for both bullish and bearish trends (Screenshots required).
a) Break of market structure
Before jumping on the break of market structure let me just tell you what market structure is. As we know there are two types of trends in a trending market that is either uptrend or downtrend. For an uptrend or bullish market, the market is structured in a way that the new high is higher than the previous high meanwhile the new lowest price must NOT be lower than the previous high and for a downtrend or bearish market the new lower must be lower than previous low and new high must NOT be higher than the previous high. If the price moves in a direction that doesn’t follow the above-mentioned structure then it is called breaking of market structure.
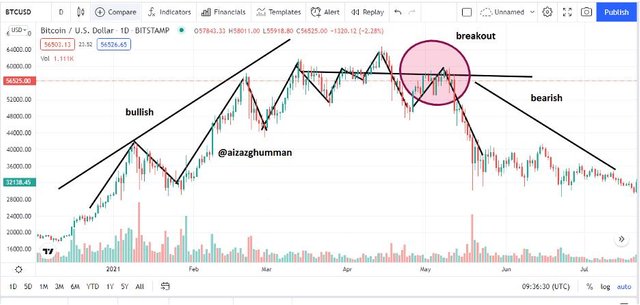
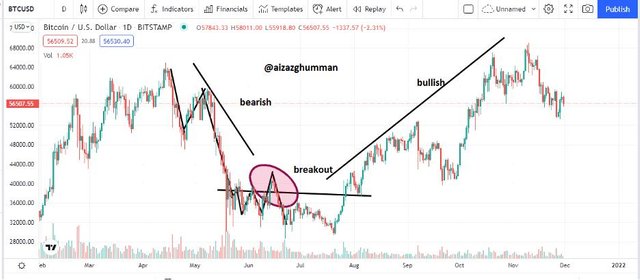
Let us understand these breaks of market structure for a bullish market through the chart given below of BTCUSD trading pair as we can see the market had been following the pattern for uptrend however at a point it broke the structure which made traders anticipate a trend reversal as we can see the market indeed reversed strongly.
Now for the bullish market, we can see in the BTCUSD chart below that market had been following the downtrend or bearish market structure however after a while the market broke the structure as the new low was higher than the previous low and the bearish trend can be seen reversing down below.
b) Break of Trendline
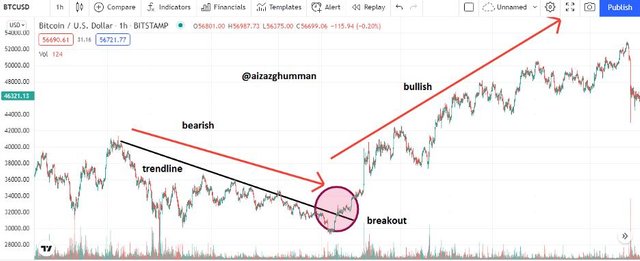
Now again before jumping onto breaking of trendline let’s dive into what it is. The trendline is a line drawn on the chart of price by connection the last lows or highs of the bullish and bearish market once the price crosses this trendline such situation is called break of trendline which makes trader expect a trend reversal for better understanding of bullish break of trendline let us again look into the btcusd chart below for where the trendline is drawn by connecting highs for bearish reversal identification however at a certain time the price passed through the trendline which helps to identify trend reversal as we can see the trend being reversed once the break of trendline occurred.
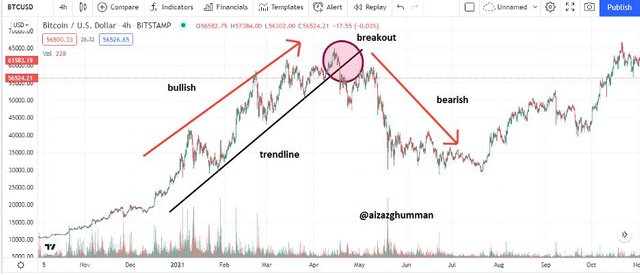
Now for a bullish reversal market look at the chart below of the BTCUSDT chart where the trend line is drawn by connecting lows however when breakage of the trend line occurs the trend is reversed and turned from bullish to bearish.
c) Divergence
Divergence here is a disagreement between indicator and crypto chart. So divergence in cryptocurrency is identified through using technical indicators and can be understood by knowing that the point where the indication of indicator and price movement moves in a direction opposite to each other is said divergence. These divergences indicate upcoming trend reversals. The bearish divergence occurs when the price follows the market structure of the downtrend meanwhile the indicator follows the structure of bullish market meanwhile bullish divergence occurs when the price follows the market structure of bullish movement while the indicator follows the market structure of bearish trend.
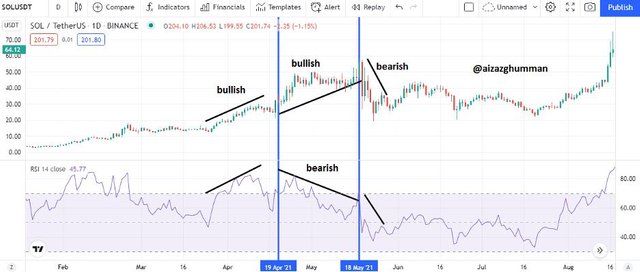
For better understanding look like the screenshot below of SOLUSDT which in this case is representing bullish divergence as we can the market had been bullish then suddenly divergence was identified and in turn the trend indeed reversed to bearish.
d) Double top and double bottom
Double tops and double tops are identified when assets fail to hit a higher place than the previous high or meet a lower position than the previous low. These also symbolize an oncoming trend reversal. The double tops help to predict trend reversal in a bullish market whereas the double bottom helps the trader to detect trend reversal chance in a bearish market for better understanding let’s have a look at examples below
Example for Double top
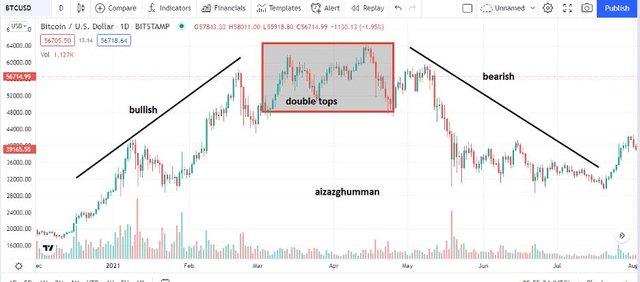
Now again in the chart of BTCUSDT, I have marked the double tops that were identified in the bullish market meanwhile after they are formed we can see there was a trend reversal and the market switched to bearish.
Example for Double Bottoms
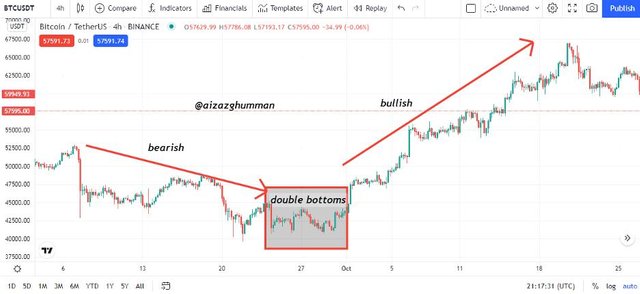
In the screenshot below of BTCUSDT double bottoms were identified in the bearish market which upon formation reversed the market from bearish to bullish hence this is how we can use double bottoms for identifying trend reversals

Place a demo trade using any crypto trading platform and enter a buy or sell position using any of the above-mentioned trend reversal/continuation patterns.
Note: that you will be patient with these patterns to unfold in the market before taking a trade. (Present a clear chart for the setup and also the proof of transaction. This can be done using any crypto-asset chart and also any timeframe).
So I’ll be performing this demo trade on the break of trend pattern anticipating a trend reversal here in the chart of BTCUSDT (again yes BTC is probably my favorite cryptocurrency) below as you can I drew the trendline connecting highs of assets in a bearish market and waited for price to cross this trend once it did then for the sake of avoiding false signal I waited for few candles to observe that made me consider this being a symbol of trend reversal so I place my buy entry assuming a bullish market and also place my stop loss and take profit value that can be seen in the chart below
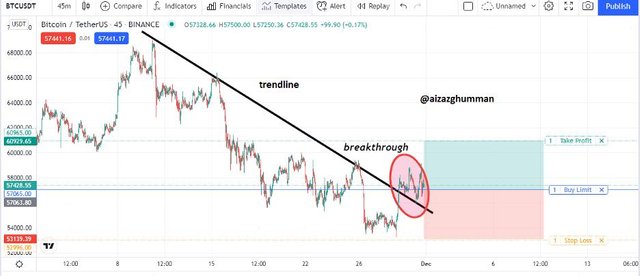
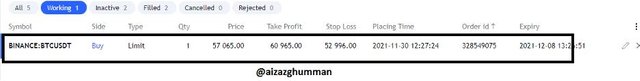
As you can I entered the market at $57065 and placed my stop loss lower than the previous low at $ 52994 as I am expecting g bearish market and set my take profit slightly higher than the n last high at $60965. My trade order details can be seen below

Conclusion
A trader needs to study these chart patterns before stepping into technical analysis. The trend reversal identification is essential for traders to be familiar with as it can save them from massive losses or can yield them maximum profits.
Several patterns can be used to identify trend reversals such as break of market structure, divergence, double tops and bottoms, and others. I was only familiar with divergence so the assignment had been a great help to know more of these patterns. Much appreciation for a professor who made it a lot easier through his lecture hoping to meet your expectation.
hello professor kindly check my home work post i put wrong tag by mistakenly kindly rewiew it again i am very thankful if you are check it again @reminiscence01
@reminiscence01 kindly check it homework post please