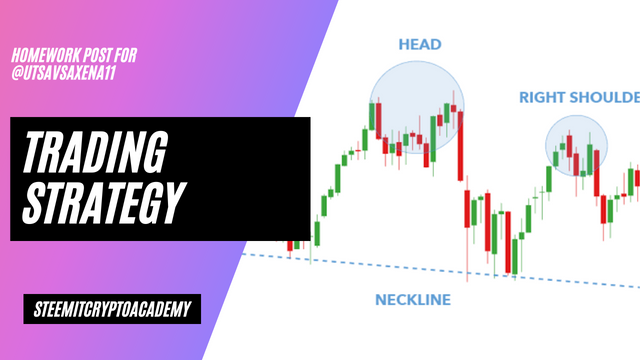
[Intermediate Course] Steemit Crypto Academy Season 5 Week 2 | Trading Strategy for Head and Shoulders and Inverted Head and Shoulders Pattern.
This is @aizazghumman; here I am going to share my homework post on the topic "Trafing strategy for head and shoulder" given by respected professor @utsavsaxena11

Explain Head and Shoulder and Inverse Head and Shoulders patterns in details with the help of real examples. What is the importance of volume in these patterns (Screenshot needed and try to explain in details?)
Chart Patterns
Head and Shoulder Pattern
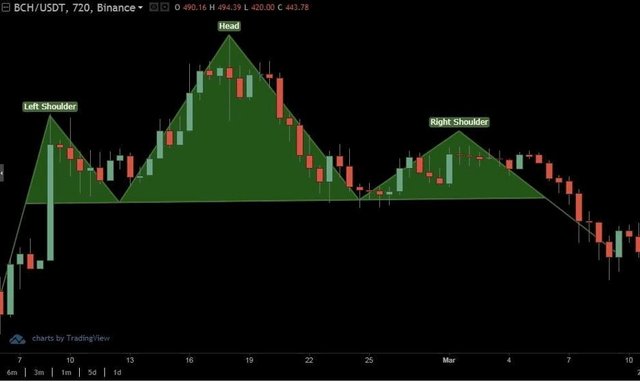
It is called the head and shoulder pattern because this pattern has the shape of the head and shoulder of the human body. The head and shoulder pattern is a trend reversal pattern in simple worlds it indicates price movement to move in reverse direction i.e. from bullish to bearish. Let’s first discuss the physical appearance of this chart pattern. The pattern starts from the left shoulder and moves at a point higher than the shoulder called head and then falls back to a position of the left shoulder called the right shoulder of this pattern. For better understanding let’s have a look at graphics of this pattern in the picture down below
As we can see the head and shoulder initiated from the left shoulder peak and ended on the peak of the right shoulder overall the pattern comprises three peaks. The head is where the asset meets rejection and price falls and when it touches the left shoulder place it is said to complete the head and shoulder paten indicating an upcoming bearish trend.
Inverse Head and Shoulder Patterns
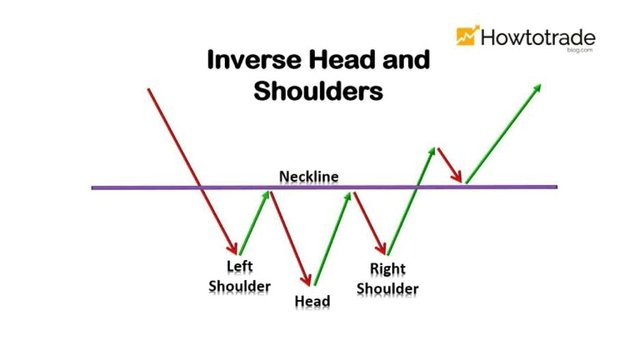
This pattern is not different than head and shoulder Patten however it is exactly opposite to it i.e. it indicates the price movement from bearish to bullish trend giving hints of the positive market to traders. However, let us first look at its apparent features. As the name implies this also upon forming gives resemblance with head and shoulder of human body however these head and shoulder are formed through the combination of three low points starting from inverted left shoulder followed by a little lower point called inverted head and then finally the inverted right shoulder that matches or is close to the position of the left shoulder. Let us have a look at the pictorial version of this trend.
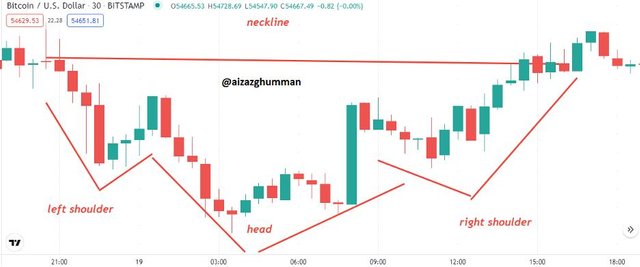
As can be seen that it comprises of maximum three lows as labeled in the chart above. This type of pattern is mostly observed in the bearish movement of the market and indicates trend reversal i.e. uptrend of price.
Importance of Volume
The volume maintains important relationships with both of the above-mentioned chart patterns, about the first chart pattern the volume is high upon the formation of the left shoulder that initiates head and shoulder pattern, however, goes down upon formation of the head and moves down further on reaching right shoulder however increaser once the bearish trend is followed now coming to an inverted head and shoulder pattern it is similar to head and shoulder i.e. it is high when left inverted shoulder is formed but goes down upon formation of an inverted head and once the neckline is broken and bullish trend is formed the volume increases. The knowledge of this pattern helps traders to perform accordingly and gain maximum profits.


What is the psychology of market in Head and Shoulder pattern and in Inverse Head and Shoulder pattern (Screenshot needed)
Psychology of Head and Shoulder Pattern
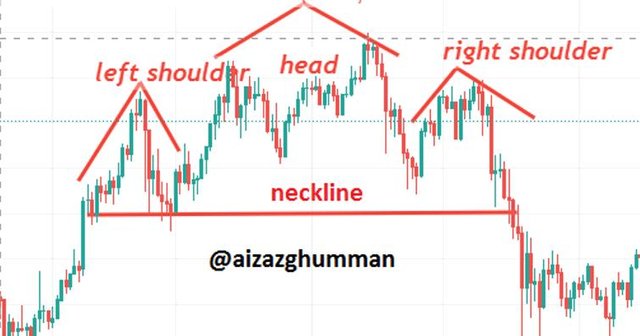
There isn’t much psych behind this pattern it is said to be a trend reversal pattern from bullish to bearish now how it does that? Let’s have a look at the chart below:
As you can see in the chart above the head and shoulder initiated from left shoulder after an uptrend of price movement of asset which is due to the dominance of buyers in the market whereas sellers bring the price down which completes the formation of the first shoulder after that the buyers get active again and take the prices at peak higher than the shoulder and a point the sellers overrule their price comes down forming head of the pattern now the buyers again bring price higher but at a position equal or close to left shoulder the sellers overrule again and the bearish trend is now followed upon passing through the neckline and increasing the volume of the asset.

Psychology of Inverse Head and shoulder pattern.
The psychology of inverse head and shoulder is similar to psych of head and shoulder pattern if inversed. Followed by the bearish movement of price the inverse head and shoulder pattern is initiated by the formation of the left shoulder due to the dominance of sellers however, soon buyers take control and bring the price higher completing the first inverse left shoulder however the sellers again take leads and bring the price of asset lower than the lowest price of left shoulder which at a point is again reversed by buyers who overrule and bring the price higher completing the head of this pattern now again shortly after this seller again try to dominate the market but soon overruled by buyers again at a point close or equal to left shoulder now if the neckline is broken then a bullish trend can be seen. Let us have a look at the picture down below for a better understanding.

Explain 1 demo trade for Head and Shoulder and 1 demo trade for Inverse Head and shoulder pattern. Explain proper trading strategy in both patterns separately. Explain how you identified different levels in the trades in each pattern (Screenshot needed and you can use previous price charts in this question)
Head and Shoulder
The trading strategy in either of these chart patterns is to wait for the pattern to complete first and then place their orders. Let us have a look at the chart below of the SOLUSDT trading pair:
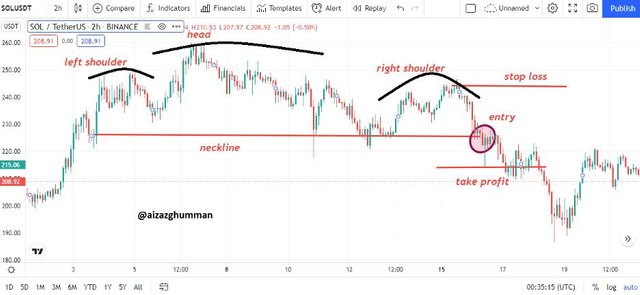
The screenshot above shows my demo trade as I place my stop loss at the tip of my right shoulder and the difference between the tip of my head and right shoulder is 10 i.e. 259 – 249. So for setting my take profit or target I subtracted neckline from the difference between the peak of the head and left shoulder. As the neckline value is 225 so the target will be at 215 us.
Inverse Head and Shoulder Pattern
Trading using this pattern can be done using a similar strategy as that of the head and shoulder pattern mentioned above i.e. to place your order after completion of the trend. Let’s look at the chart below I’ll be using to demonstrate a demo trade on trading pair BTCUSD
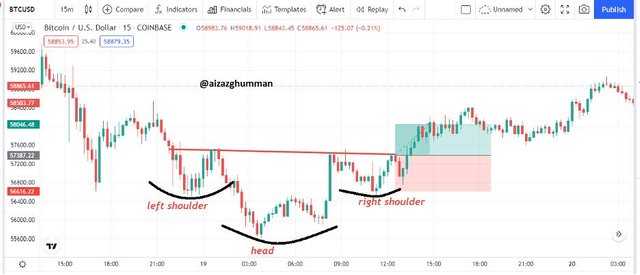
Here in the chart above it can be seen I placed my order once the neckline is crossed. I placed buy entry at 57387 USDT as it can be seen I have selected 15 m timeframe chart so the difference between the low tip of the head and the left shoulder is 1 which I added to the value of neckline is 57387 however after adding the value one it becomes 58$ and that’s where I placed my target or simply take profit.

Place 1 real trade for Head and Shoulder (at least $10) OR 1 trade for Inverse Head and Shoulder pattern (at least $10) in your verified exchange account. Explain proper trading strategy and provide screenshots of price chart at the entry and the end of trade also provide a screenshot of trade details. (Screenshot needed.)
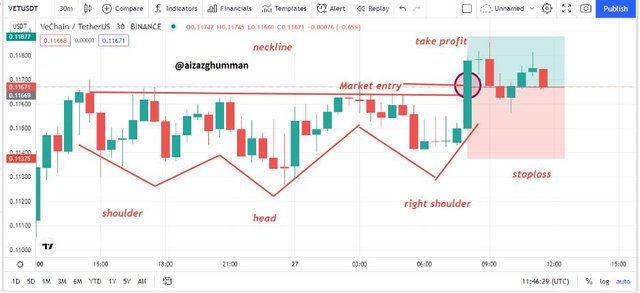
For this when I entered the market of VETUSDT trading pair I was able to detect inverse head and shoulder patterns in 30 min time frame chart so I’ll be doing a trade using inverse head and shoulder pattern.
I marked the head and shoulders of this pattern and waited for a pattern to complete once it did and crossed the neckline I decided to take entry in the market and place my buy order and set my take profit at a position above the neckline which can be seen in the screenshot below and set stop loss below the lower peak of the right shoulder.
Trading strategy
The take profit was set by subtracting the value of highest and lowest values of price ahead of this pattern and then adding the value of the neckline.
Now here in the screenshots down below, you can see I purchase VET coins of $13 when the average market price was $0.1129
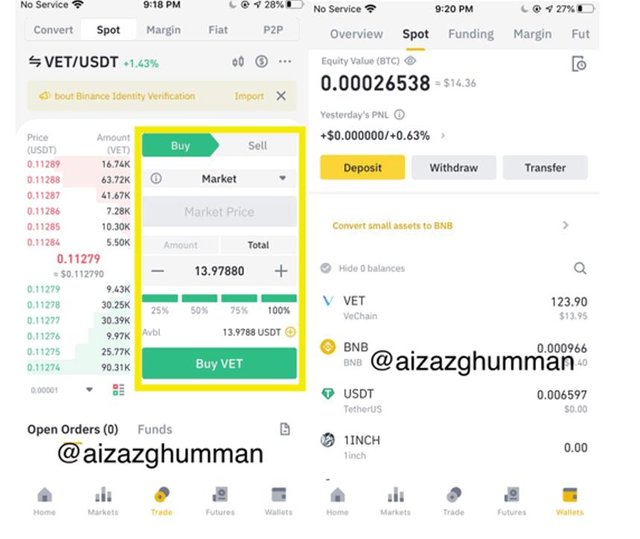
Since I carried out this trade this today only so I the trade hasn’t hit the take profit or stop loss yet.

CONCLUSION
It is necessary for traders who trade through technical analysis to learn all types of chart patterns to earn them a maximum pattern. There is multiple chart pattern that we come across on our charts however I’d say the easiest to figure or evaluate is head and shoulder or inverse head and shoulder pattern. Both have the same fundamentals but are structurally different from each other. A head and shoulder is followed by a bullish market and changes direction to bearish trend whereas the inverse head and shoulder trend is followed after bearish trend and the market is reversed to bullish direction.
In simple words, these indicators are trend reversal indicators. The neckline here in this pattern plays a key role and helps the trader to take their positions accordingly. So far I enjoyed doing this homework post hope I met the expectations. Much appreciation for the professor's amazing lecture that helped a lot.