Crypto Academy week 6 season two - Homework Post For [@kouba01]- Trading with MACD indicator.
This is @AizazGhumman, here I am going to share my homework post on topic " Trading with MACD indicator. " given by respected professor @kouba01
.jpg)
1.What is the MACD indicator simply? Is the MACD Indicator Good for Trading Cryptocurrencies? Which is better, MACD or RSI?
MCAD stands for Moving Average Convergence Divergence. MACD (moving average convergence/divergence) is a trading indicator developed by Gerald Appel in the late 1970s for technical analysis of stock prices. Its purpose is to reveal changes in a stock's price trend's strength, direction, momentum, and duration. It is
an indicator of a relationship between two moving averages of the price of a
security. The two moving averages are taken as 26-period EMA and 12-Period EMA.
When we subtract 26-period EMA from 12-period EMA, the result is referred to as
the MACD line. The indicator is used to determine the momentum of stocks or
cryptocurrencies and their trends. This aids the traders In speculating the right
trends.
The MACD indicator is very reliable for crypto trading because it gives very strong trading signals and is very simple to use.
According to many experts, the RSI indicator gives fewer false results and is technically more correct. RSI measures the momentum of the market in terms of highs and lows in the past. If used together, MACD and RSI indicators give the best results.
1.How to add the MACD
indicator to the chart, what are its settings, and ways to benefit from them?
1.I used CoinGecko.
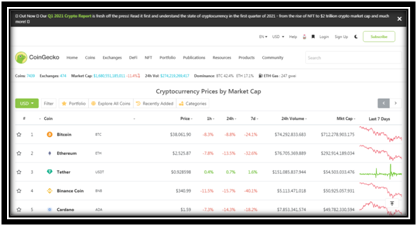
2. i opened their website . and select bitcoin from the currency

3.And then,
on the top, I clicked on charts.
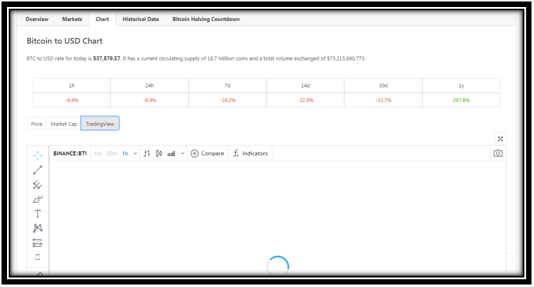
4.After that,
I selected the trading view.
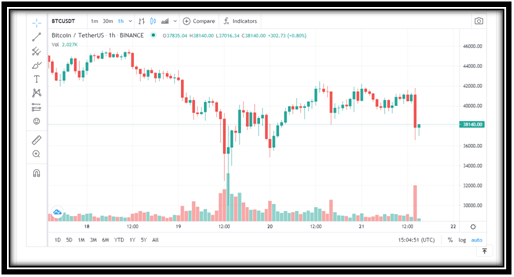
5.From the
above toolbar, I clicked on indicators.
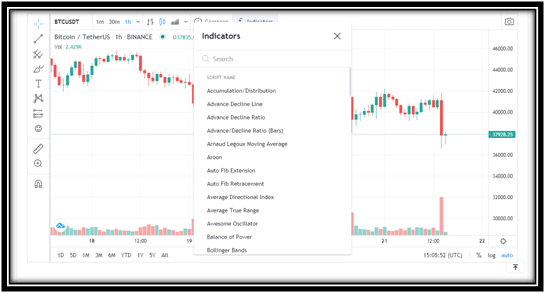
6. I typed the
MACD indicator.
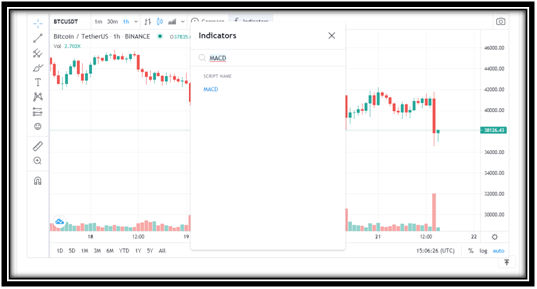
7. The MACD indicator was added to my chart.
Settings: The default
settings of the MACD indicator is set to 12, 26, and 9. 12-period EMA tracks
the trends of the past two weeks, 26-period EMA track the trends of the past
month, and 9-period EMA track the difference between the two and tells the
trends of the past week and a half. You can also change these settings like
various traders use a combination of 5, 42, and 5.
Benefits: These
settings are very flexible and can
be adjusted according to the traders' suitability. The benefits of the default
settings are that, as almost all traders around using these
settings, it's easy to understand what
indicators others traders will follow. In this way, the price moves according
to the indicators.
2. How to use MACD with crossing MACD line and signal line?
And How to Use the MACD with the crossing of the zero lines?
.png)
In a MACD indicator, the red line represents the signal
line. The blue line is the MACD line. The zero line is the line along which the
candles move up and below.
The MACD line helps us to understand the upward and downward market trends. The MACD line is studied in a comparison of the MACD line and the signal line. When the market picks up momentum, the two lines diverge from each other, and when there is a drop in the momentum, the two lines converge.
To put it into simple words, we can say buy when the MACD
line crosses the zero line and goes above it when the MACD line crosses the
zero line and goes below it sell the assets.
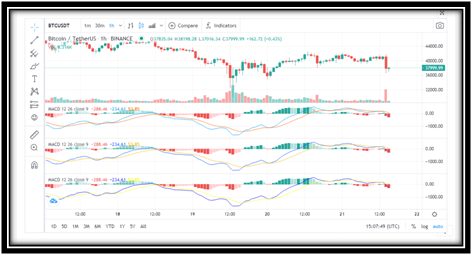
3.How
to detect a trend using the MACD? And how to filter out false signals?
You
can detect a trend using the blue MACD line. You can see an interaction between
the blue, red, and zero lines in the below image. The red line indicates the
signal line. The blue line has gone below the red line in areas where the trend
has changed to the downside (green arrow). And in areas where the blue line is
above the red line, the market's trend has shifted to the upside (red arrow).
.png)
MACD can not be considered as a way to understanding how the market will behave in the future. However, when a MACD line crosses above the signal line, the price of the underlying security declines. This can be termed as a false positive signal. Visually when the two lines give shallow indicators in the form of shallow crossovers (blue arrow). Or when there are very small candles formed, it is a false signal.
To understand clearly, we can look at the histogram. When
the candles move above the zero line, it is an ideal time to buy, and when the
candles grow below the zero line, it's time to sell.
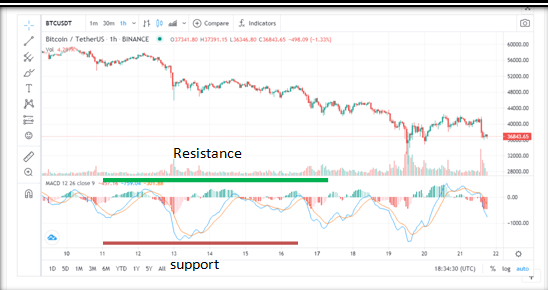
4. How can the MACD indicator be used to extract points or support and resistance levels on the chart? Use an example to explain the strategy.
Drawing support and resistance lines is like creating a
channel on a MACD indicator. It offers a clear picture of the momentum of the
market. The support channel can be drawn to decide about buying or selling. The
support channel is drawn below the zero lines on the histogram, whereas the
resistance channel is drawn above the zero lines. Below is an example to
explain the channeling.
.png)
5.Review the chart of any pair and present the various
signals from the MACD.
Below is the chart for BTC/USD. If we take the trade as the
crossovers of the MACD line, we can buy the asset when the MACD line is above
the signal line, and we can sell or short it when the MACD line is below the
signal line. When the next cross occurs, the previous trade is closed or is
taken off the table. I have roughly indicated two trades, for instance. One was
ideal for buying and the other for selling.
.png)
Cc:
@steemitblog
@kouba01
Hello @aizazghumman,
Thank you for participating in the 6th Week Crypto Course in its second season and for your efforts to complete the suggested tasks, you deserve a 3/10 rating, according to the following scale:
My review :
An article with poor quality content, your writing style lacks a clear methodology, so we find ideas scattered with no links and what makes your answers inaccurate. Try doing more research and improving your writing style by reading some good articles.
Thanks again for your effort, and we look forward to reading your next work.
Sincerely,@kouba01