Bichi Indicative Strategy- Steemit Crypto Academy- S5W6-Homework post for @utsavsaxena11.
Question 1:
Give a detailed analysis of BICHI STRATEGY. Staring from introduction, identification of trends, trend reversal in market, entry and exit from the market, one demo trade and finally your opinion about this strategy. (Screenshot required). [4 points]
Introduction:
The bichi strategy is one of the strategies discovered by the professor himself that involves the use of two indicators that goes with the name of Bollinger band and Ichimoku clouds these indicators are combined on a chart and are used to calculate the market movement and upcoming trend.
The term Bichi is coined by taking B from Bollinger bands and ichi from Ichimoku indicator’s initials. This indicator helps in identifying market trends and their reversal that can help traders to make entries or exit at right time in the market. Since it involves two types of indicators hence the entry and exit points are marked by considering both of these indicators however we’ll be discussing this in-depth later in this question.
Identification of trends And Trade Entry and Exit:
As we know there are two types of the market either ranging or trending so the trending markets are further divided into two types that are uptrend or downtrend now with here’s how we can identify these trends using this strategy:
Identifying Uptrend and trade entry:
Now before we come on identifying uptrend let us discuss the apparent features of indicators used in this strategy so as we know that boiling indicator is popular for showing support and resistance levels along with baseline on price chart meanwhile the Ichimoku cloud indicators comprises of cloud-shaped structure that helps trader to identify trend reversals so when the price is moving in an upward direction along with Bollinger bands resistance line i.e. the resistance level also moving upward and the baseline below to price chart value hence and eventually price crosses the Ichimoku cloud too hence a bullish trend is said to be identified and traders can mark pace their buy entries in the market then.
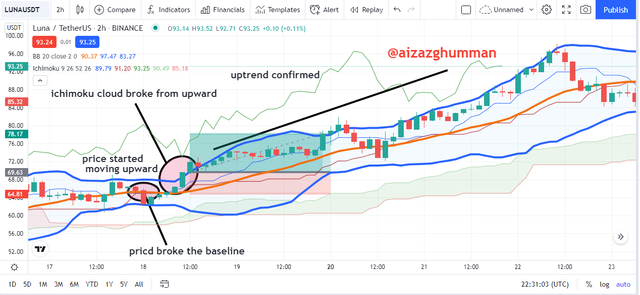
So in the chart, above we can see the chart of crypto-asset trading pair LUNAUSDT that the price slightly started moving upward and the Bollinger bands movement started in the same direction such that the baseline turned out as a dynamic support line and price too crossed Ichimoku indicator ensuring the bullish trend so once it crossed I made my trade entry and set my stop loss and take profit value in 1:2 ration i.e. the profit is twice of what stop loss value is.
Identifying Downtrend and Trade Exit:
So again before we come on identifying downtrend let us discuss the apparent features of indicators used in this strategy so as we know that boiling indicator is popular for showing support and resistance levels along with baseline on price chart meanwhile the Ichimoku cloud indicators comprises of cloud-shaped structure that helps trader to identify trend reversals so when the price is moving in a downward direction along with Bollinger bands support i.e. the support level also moving in the downward direction and the baseline above to price value hence and eventually price crosses the Ichimoku cloud too hence a bearish trend is said to be identified and traders can mark pace their sell entries in the market then.
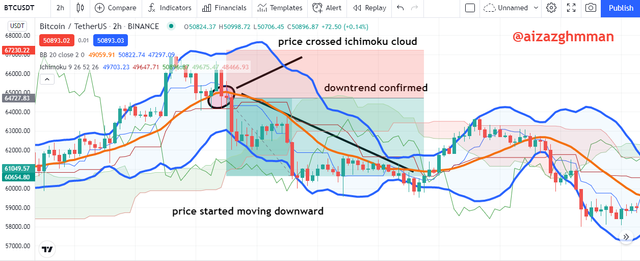
So in the chart, above we can see the chart of crypto-asset trading pair BTCUSDT that the price slightly started moving downward and the Bollinger bands movement started in the same direction such that the baseline turned out as a dynamic resistance line and price too crossed Ichimoku indicator ensuring the bearish trend so once it crossed I made my trade sell entry or exit and set my stop loss and take profit value in 1:2 ration i.e. the profit is twice of what stop loss value is.
Trend reversal in the market:
Trend reversal using bichi trading are easy to identify and doesn’t ask for much effort trader who is familiar with the use of Bollinger band would know that a trend is likely to be reversed when markets shift to ranging mode now when price and Bollinger are in ranging market movement and eventually price crosses Ichimoku's indicator cloud so trend reversal can be confirmed in this strategy.
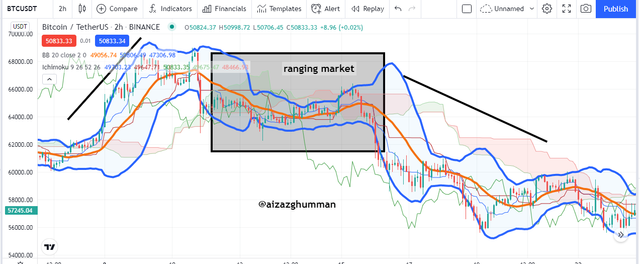
In the chart above we can identify a ranging market and Bollinger bands corresponding to price movement now we can see when the price crossed Ichimoku cloud so a trend reversal signal was identified and we can see the trend indeed reversed and the market shifted from bullish to bearish.
Demo trade:
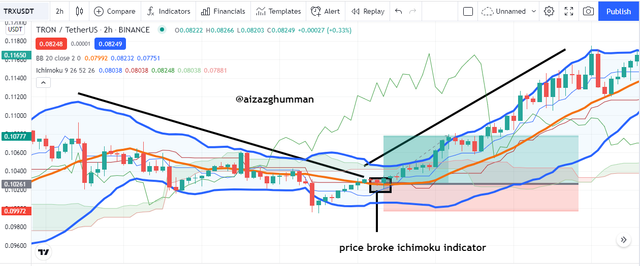
We already discussed the trading exit and ending criteria above in this question using this strategy so as I’ll be carrying out my buy entry demo trade using that criteria so as we can see in the chart below of trading pair TRXUSDT the market was initially bearish and started moving upwards such the Bollinger band also started moving upward and baseline eventually is acting as dynamic support level so as we saw the price crossing the Ichimoku cloud I placed my buy entry and set my take profit and stop loss value in 1:2 ratio such that my profit value was two times more than the distance of stop loss.
Opinion about this strategy:
I found this strategy quite useful for traders as it can help them to confirm the strength of a market trend or be alarmed by an upcoming reversal. This strategy is easy for newbie traders to once they understand it thoroughly, plus with this strategy, I have started thinking there must be other strategies we can come up with using different indicators. However, since crypto markets are volatile so no trading strategy can assure 100% success but with this strategy, trading would be done based on more authentic indicators.
Question 2:
Define briefly Crypto IDX and Altcoins IDX. What is signal prediction trading? Is it legal or ill-legal in your country? (Explain briefly) [2points]
Crypto IDX:
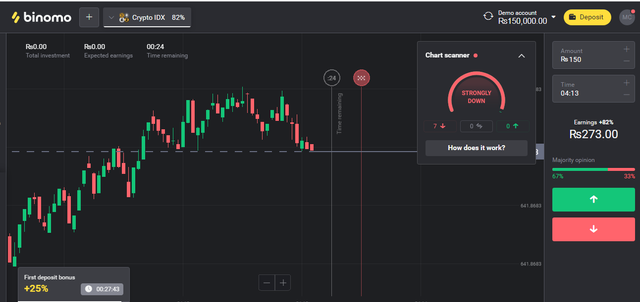
Crypto IDX stands for cryptocurrency index and it is simply the merger of at least 4 cryptocurrency assets to find out their average however in the case of crypto IDX those four currencies are bitcoin, ethereum, zcash, litecoin this average is calculated on a Binomo platform and the traditional software’s can’t really help in this.
The screenshot below shows how we can take part in prediction trading of Crypto IDX on binomo app.
Altcoin IDX:
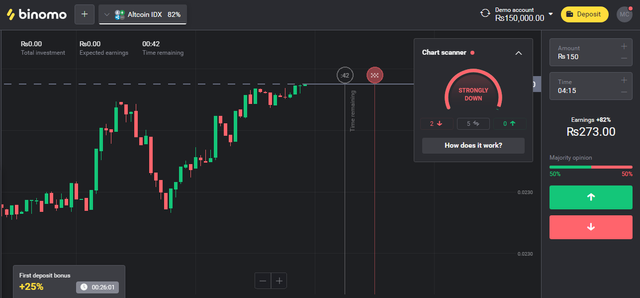
The Altcoins index is the same as that of the crypto index and is average 4 altcoins that in case of the Altcoins index are Ethereum, Ripple, Monero, and litecoin. This again is approachable on binomo platform. The average of this coin is derived from complex software hence one cannot crack it thoroughly or more like manually.
The screenshot below shows how we can take part in prediction trading of Altcoins IDX on binomo app.
Prediction trading:
Prediction trading can be understood via its name alone that is here trades are made upon prediction before discussing it in detail one should know it’s also called optional trading. So the prediction trading works like here we predict the average discussed above i.e. crypto IDX or altcoin IDX so we predict the average value after a chosen time that it will increase or decrease now one stakes assets to make this prediction so if the results are according to traders prediction then trader based on its chosen increment or decrement will earn a profit however in case of the wrong prediction the trader would eventually lose his investment too.
Is it legal in Pakistan?
Cryptocurrency overall in my country Pakistan is not illegal but nor it's exactly legal as the concept hasn't been introduced properly so binomo is among one of the most popular trading platforms of Pakistan So It's not illegal here but still since people are not familiar here so it is not adapted by people here yet nor the authorities here recognize such acts as something official so the crypto is yet to have official permission for users here to carry out better trades and benefit from cryptocurrency and its different trading ways such as optional or prediction trading
Question 3:
If you want to create your own penny IDX, then which 4 penny assets will you choose, and what is the reason behind choosing those four assets. Define Penny currencies. (Explain, no screenshot required). [2points]
Penny currencies:
If we talk generally penny currencies are currency or more like coin that defines the one cent of US or Canadian dollar or one penny of a pound. In simple words, it defines the 100th portion of a dollar or pounds. But in crypto, the penny currencies are those tokens that can be purchased in amounts less than $1. These penny crypto assets have a volatile market and can be used to earn high profits.
CREATING MY OWN PENNY IDX:
If I create a penny IDX of my own that will involve the following 4 crypto asset pairs are Stellar (XLM), VeChain (VET), Chiliz (CHZ), and Zilliqa (ZIL). These tokens have a high market cap and are also cheaper to invest and as we know these two symbols are strong signals of investing in crypto assets. From their price chart, I can see them rising high so I’d consider these two assets in the coming year for investing.
Question 4:
Conclusion:
The bichi strategy we studied here is indeed very easy and helpful to traders it involves the use of two indicators that are Ichimoku cloud and Bollinger bands with the help of these indicators we can identify the strength of a market trend and also we can be analyses upcoming market reversal so we can enter and exit the trade at right time.
After that, we covered the CryptIDX and Altcoins IDX that can be used for participating in optional trading on binomo platform. Lastly, I gave out my reason and pair if I create my penny IDX. Thanks to the professor for this unique set of assignment questions it was fun to work on this and study for it hope I met your requirements for this task.