On-chain Metrics(Part-3)- Steemit Crypto Academy- S4W5- Homework Post for professor @sapwood
Onchain Metrics(Part-3)
How do you calculate Relative Unrealized Profit/Loss & SOPR? Examples? How are they different from MVRV Ratio?
Relative Unrealized profit/loss
Unrealized profit/loss is the estimation of profit and loss before the asset is sold once the asset is sold the profit and loss then is termed to the realized profit loss. For calculating the unrealized profit loss we used the last spent UTXO prices rather than the market prices of an asset. It is simply the difference of the current price and the realized price. On the other hand as the realized cap is based on the realized prices or the prices at which the unspent transaction was last moved and market cap is based on the current price for the calculation we can take
Unrealized profit/loss= Market cap-Realized cap
The positive value shows profit whereas the negative value shows loss
The Relative Unrealized profit/loss is taken as the ration of difference of market cap and realized cap to the market cap thus
It is taken as:
Relative Unrealized profit/loss= (Market Cap - Realized Cap) / Market Cap
Example:
Consider an asset has a
Market Cap = $33,300,000
Realized Cap of LTC = $29,700,000
Unrealized profit/loss= Market cap-Realized cap
Unrealized profit/loss= 33,300,000-29,700,000= 3,600,000$ (positive value and thus profit)
Relative Unrealized profit/loss= (Market Cap - Realized Cap) / Market Cap
Relative Unrealized profit/loss= 3,600,000/33,300,000=0.108 or 10.8%
SOPR
SOPR stands for Spent output price ratio. It is the ratio of the current price of the UTXO to the price of its creation. It is used to determine local tops and bottoms in the market. Based on its values and below the level 1 swing highs and lows can be predicted. It is calculated as
Spent output price ratio= current price of the UTXO/ price at which it was bought
Example
Consider Price paid for UTXO= $297
Current price of a UTXO= $333
The SOPR= 333/297=1.12 represents an upcoming local top and in term sof profit loss it indicates profit as the price of the UTXO has increased over the time.
SOPR, RUPL vs MVRV ratio
These can be differentiated comprehensively in terms of market cap and realized cap
⦁ RUPL is the ratio of the difference between the Market Cap and Realized Cap to the Market Cap. All variables in the ratio are taken at the same time. It pinpoints historical or cyclic highs and lows.
⦁ SOPR is the ratio of the most recent Realized Cap to its previous Realized Cap or the value of UTXO at the time of purchase and sale. It indicates local tops and bottoms.
⦁ MVRV is a ratio of the Market Cap to the Realized Cap. The time for the two quantities is kept same. It indicates the undervalued and overvalued conditions of the market.

(2) Consider the on-chain metrics-- Relative Unrealized Profit/Loss & SOPR, from any reliable source(Santiment, Glassnode, LookintoBitcoin, Coinmetrics, etc), and create a fundamental analysis model for any UTXO based crypto, e.g. BTC, LTC [create a model to identify the cycle top & bottom and/or local top & bottom] and determine the price trend/predict the market (or correlate the data with the price trend)w.r.t. the on-chain metrics? Examples/Analysis/Screenshot?
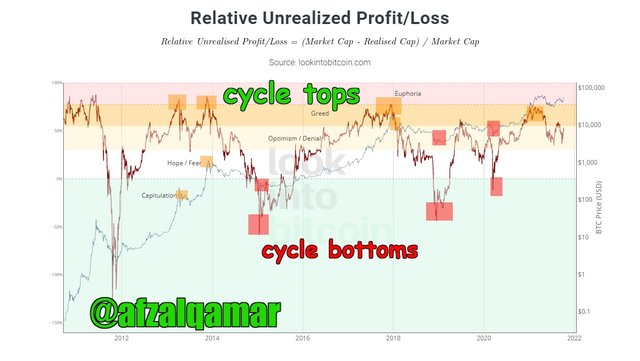
RUPL 8 years
The orange squares indicate the cycle tops whereas the red squares represent the swing lows in both the price action and the RUPL. As a general rule when the RUPL moves above the 75% mark it is followed by a swing high in the price and when it moves below the 0% it is followed by swing low in the price action. The chart above indicates that On 18th November 2013, we saw a taking profit zone when a significant high swing when the RUPL line moved to the 86% the price reached up to $1,183. As soon as the RUPL begin falling and crossed the 25% marked we saw the price line making a swing low the price reached up to about $400 until the RUPL reached 19%.
Similarly it reached up to -59% on 14th January 2015 and the price reached up to $241. Hence the market was in phase of accumulation. And again in December 2017 RUPL hit the 78% level and price reached at $19,325. The RUPL thus we see a direct correlation between the price movement and the RUPL as the price surges to top when the RUPL moves above 78% and dips bellows it approaches the 0% or goes below it.
SOPR (3 years)
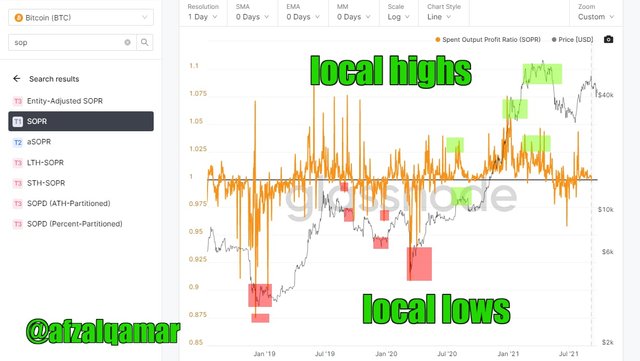
The squares in the green indicate highs whereas the square in the red indicate lows of the market. The chart above shows that the SOPR was at around 0.87 the price of BTC was touching $3,753 on December 5 2018. The market was thus was reaching close to the support. the SOPR reached 0.97 and another local bottom was formed and then another when it reached 0.9 again but as soon as the SOPR reaches 1.07 the price followed the upward pattern and was found forming a high swing with the price tag of BTC reaching $27.098. The chart thus shows a direct correlation between the price movement as when the SOPR dips below 1 the price line makes a low swing and when it surges above the price line makes a high swing.
Write down the specific use of Relative Unrealized Profit/Loss(RUPL), SOPR, and MVRV in the context of identifying top & bottom?
Investors use these metrics for designing long term analysis
RUPL
⦁ RUPL values signifies upcoming or nearing cycle tops and bottoms calculated by taking the ratio of difference in the values of market and realized cap in relation to the market or total supply.
⦁ A value above 0.75 signifies that the market is heading towards the zone of taking profit. A cycle top can thus be anticipated.
⦁ A value below 0.25 simply indicates an accumulation zone and anticipates the formation of a cycle low.
SOPR
⦁ SOPR value signifies the local tops and bottoms of the market calculated by taking the ratio of bought and sold prices of a UTXO.
⦁ A value above 1 indicates a profiting market situation and indicates the formation of a local top.
⦁ The value below 1 indicates a loss situation and predicts the formation of a local bottom.
MVRV ratio
⦁ MVRV ratio signifies the oversold and overbought of an regions in the market and is calculated by taking the ratio of market cap and realized cap.
⦁ A value above 300% signifies and overbought condition in the market.
⦁ A value below 100% indicates an overbought condition in the market.
⦁ MVRV ratio is widely coupled with the above 2 to place the right buying and selling trades.
⦁ After an overbought condition as the price is expected to fall sells signals are indicated and after an oversold condition as the price is expected to rise buy signals are indicated.
Conclusion
For long term investors the on-chain metrics like UPL which indicates profit and loss before the asset is sold and RUPL that indicates cycle tops and bottoms and the SOPR which indicates local tops and bottoms are significantly important. MVRV ratio is often used with these metrics on the chart to draw a better fundamental analysis of the asset involved.
Cc:- @sapwood