Candlestick Patterns - Steemit Crypto Academy Season 5 - Homework Post for Task 10

Trading and investing in cryptocurrency is very risky. A beginner who is yet to understand the principles of trading in cryptocurrency shouldn’t dive into investing as this has caused a lot of heartbreaks to newbie’s. As they invest and in a jiffy everything disappears. Candlesticks are great tools that provides effective technical analysis which could save investors in cryptocurrency the heartbreak of losing their tokens.

Explain the Japanese candlestick chart? (Original screenshot required).
Bar chats and line graphs have gradually become backward and old-fashioned with respect to modern day stock trading. Candlesticks have become a much easier and effective. Understanding price action and patterns in stock trading, buy low and sell high are the foundation of trading and the Japanese candlestick makes this very easy.
Japanese candlestick chart is the graphical representation of an asset. These candlesticks is formed from the interaction between buyers and sellers on a particular asset.
It was developed by Munehisa Homma a Japanese rice seller born in 1724 popularly called “god of the market”. He was among the first and most famous business men in japan to use past prices to predict future prices. This in-turns yielded great fortune for Homma.
IN YOUR OWN WORDS, EXPLAIN WHY THE JAPANESE CANDLESTICK CHART IS THE MOST USED IN THE FINANCIAL MARKET
The Japanese candlestick pattern is not ambiguous. The illustrations and deductions drawn from the graph makes it easy to understand past patterns the different prices at different period and the reasons behind the changes. With the information it is easier to understand and make good decision.
The candle stick charts are flexible as it can be used alone or in combination with other technical analysis techniques.
It gives a comprehensive detail of the market structure over a period of time and this can help traders make intelligent decisions based on the outcome of the analysis.
The terminologies used in the Japanese candlestick are also interesting and can spark ones interest. Just like the “Hanging-man line” in bearish candle.
DESCRIBE A BULLISH AND A BEARISH CANDLE. ALSO, EXPLAIN ITS ANATOMY.
The term bullish in stock market is characterized by rising value while bearish is characterized by increasing value.
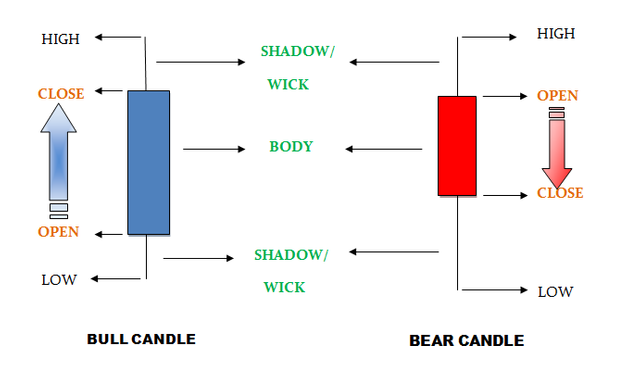
The bullish candle is represented in green color while the bearish candle is represented in red color. The highest price is is located at the top of the bar while the lowest price is located at the bottom of the bar.
Bullish Candle:
The close value of the candle is always above the open value of the candle, the gap between the close and open doesn’t matter. It is called bull because the nature of the candle shows upward movement like a fighting Bull. The bull candle starts from down and moves upwards which symbolizes rise in stock.
Bearish Candle:
In the bearish candle the close value is always below the open value of the candle, how much the gap between the close and open doesn’t matter. It goes from TOP to BOTTOM. If we see the above picture the candle that is in red color represents the bear candle in which the close point is below the open point. So bear candle starts from up and moves to down.
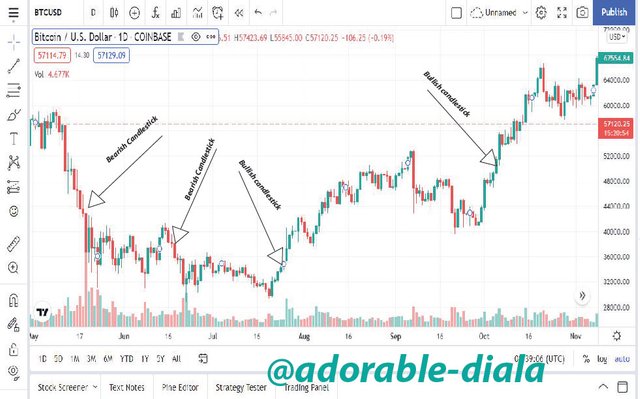
The green arrows points to the Bullish candles. while the red arrow points to the Bearish candles.
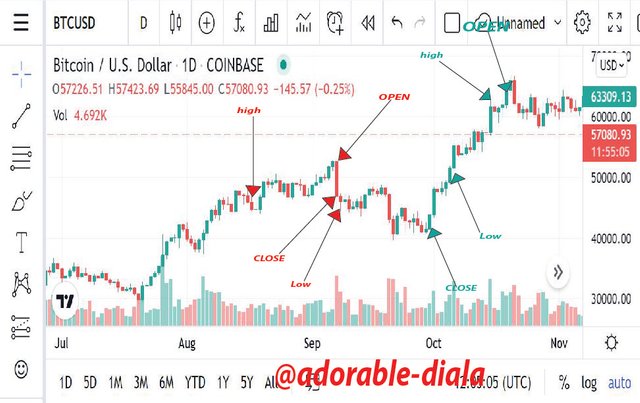
The table below summarizes a trading action displayed using a candle stick over a a period of time by reading the price points
| Price point | meaning |
|---|---|
| Open | price at the beginning of the period |
| Close | price at the end of the period |
| High | the maximum price achieved during the period |
| Low | the lowest price of asset during the period |
| Upper Shadow | The vertical line between the high of the day and the closing price (bullish candle) or open (bearish candle) |
| Real Body | The difference between the opening price and closing prices. |
| Lower Shadow | The vertical line between the low of the day and the open (bullish candle) or close (bearish candle) |
References
https://commodity.com/technical-analysis/candlestick-basics/
https://www.blogarama.com/investing-blogs/1289739-forextradex-blog/20900698-what-candlestick-bullish-bearish-candles-forex-trading