Crypto Academy Season 4 Beginner's Course-Task 10: Candle Stick Patterns
Introduction
Candlestick patterns - Steemit Crypto Academy Season 4 - Homework Post for [ @reminiscence01 ] Task 10.
solar-star (64)Beginner[3,5]in SteemitCryptoAcademy • 6 days ago
Greetings to everyone, I want to appreciate @reminiscence01 for such a great lecture on candle stick patterns. It was indeed a great privilege learning from you. Below are the answers to the question that was asked
1a) Explain the Japanese candlestick chart? (Original screenshot required).
b) In your own words, explain why the Japanese Candlestick chart is the most used in the financial market.
c) Describe a bullish and a bearish candle. Also, explain its anatomy. (Original screenshot required)
2 a) In your own words, explain the candlestick patterns and their importance in carrying out effective technical analysis.
b) In your own words, explain the psychology behind the formation of the following candlestick patterns.
Bullish engulfing Candlestick pattern
Doji Candlestick pattern
The Hammer candlestick pattern
The morning and evening Star candlestick pattern.
The Harami Candlestick pattern.
3 a) Identify these candlestick patterns listed in question 2b on any cryptocurrency pair chart and explain how price reacted after the formation. (Original Screenshot of your chart required for this exercise).
b) Explain the measures taking by the trader before trading candlestick patterns.
c) Using a demo account, open a position (buy or sell) on two crypto assets using any candlestick pattern and explain your reason for taking the trade. You can perform this operation using lower timeframes. (Show screenshots of your position and also your chart.

This candle stick was developed by a Japanese rice trader by name Munehisa Homma. It was particularly helpful to the japanese people especially when the Japanese stock market began operation in the 1870s. Steve Nison, an american technical analyst introduced this concept to the western people through one of his book "Japanese candle stick charting technique" since then, its popularity has grown exponentially over the years and its now a very useful technical indicator used especially by experts to analyse the financial market.
IN YOUR OWN WORDS, EXPLAIN WHY THE JAPANESE CANDLESTICK CHART IS THE MOST USED IN THE FINANCIAL MARKET
Easy to use
The chart is probably very easy and simple for traders to understand. It only requires a basic knowledge of technical analysis and anyone can use it to monitor price movements in the financial market.
It Identifies market trends
This tool helps traders to quickly identify the current trend in the financial market. By so doing,the trader can easily know when to buy an asset and when to sell it off
it shows the current state of the market
Due to its appearance in terms of colours, the current state of the can easily be deciphered. This will help determine the exit points and the entry points in the financial market which is very vital
It provides detailed information
This particular tool gives the trader access to detailed information on the direction of the market. One can easily get this information just at a glance which is something lacking very much with the bar chart.
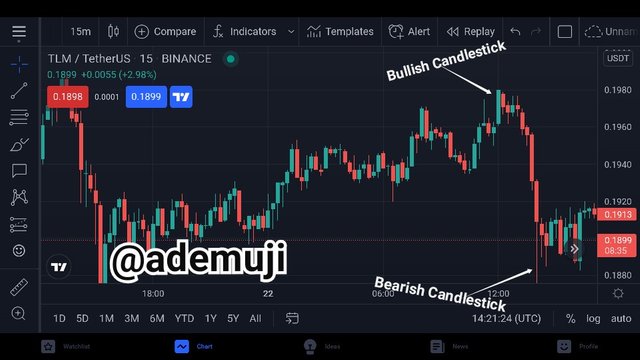
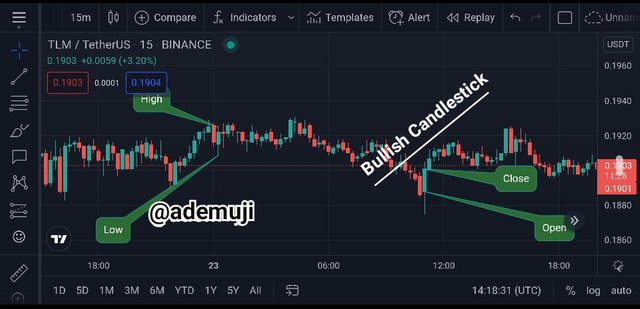
BULLISH CANDLESTICK'S
A bullish candle is simply a green or white candle which indicates that the market is about to experience an uptrend. This candle just as the name implies signifies that the bulls are about to take over the market, this presents to the traders the choice of opening a long position.
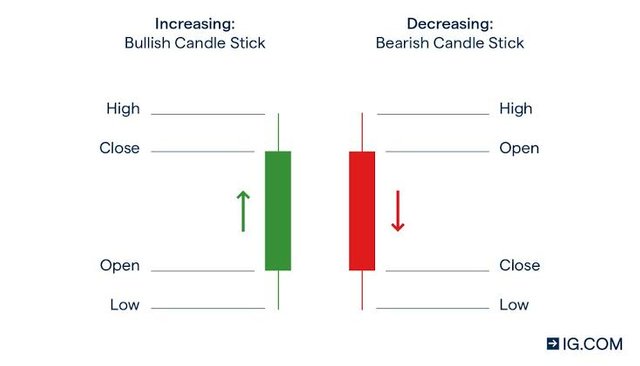
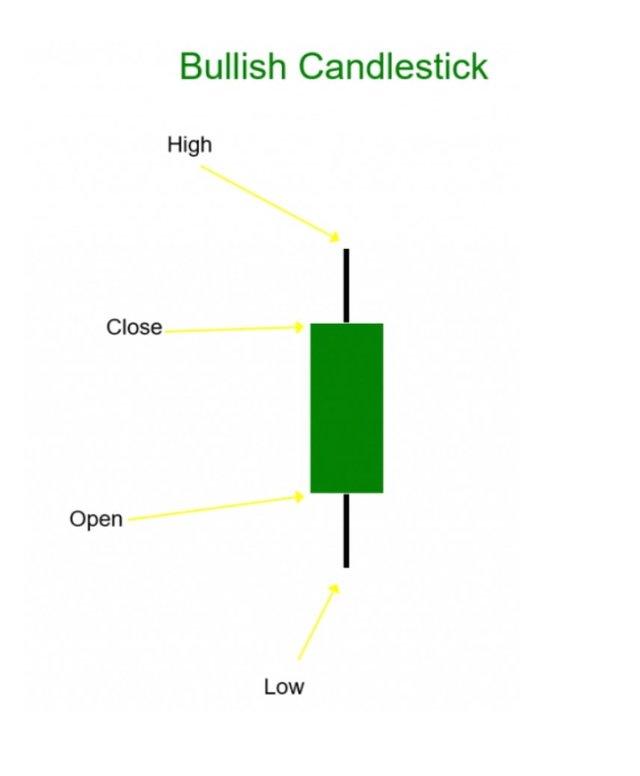
A Bullish Candle's Anatomy
The high: this denotes the lowest price of an asset in the financial market at a particular period of time.
The Low: this denotes the lowest price price of an asset in the financial market at a particular period of time.
close: this is the price in which the market is set to have close within a particular time frame
open: this is the price at which the market is said to have open within a specific time frame.
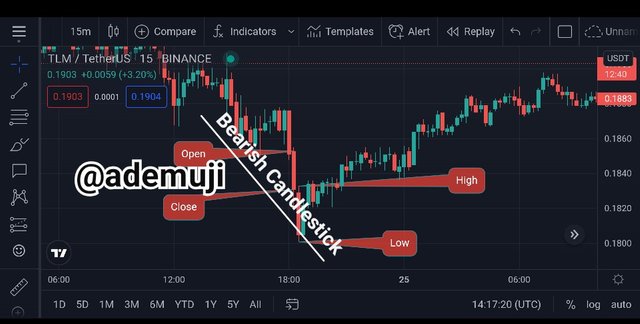
BEARISH CANDLESTICKS
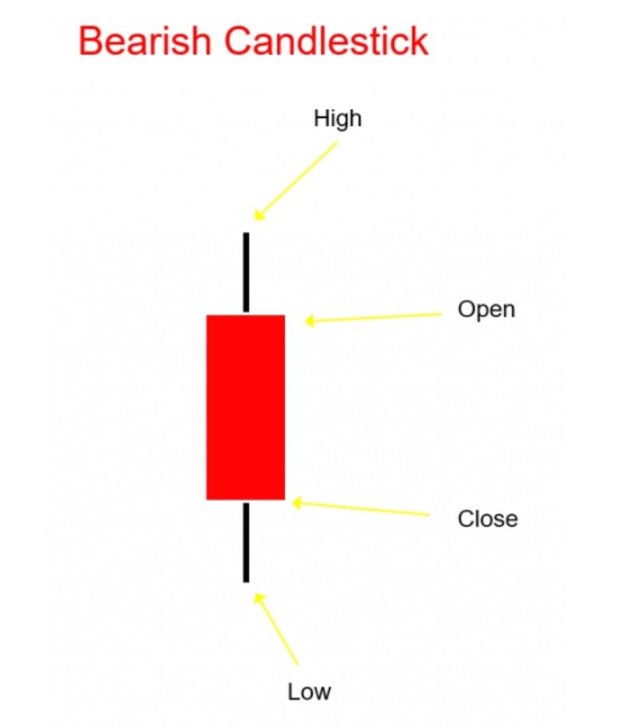
A bearish candle stick is simply a red or black candle which signifies that the market is about to experience a downtrend. All traders watch out for this particular signal for deciding on when to a buy a particular asset as constant bearish candle can lead to significant losses in the financial market.
A Bearish Candle's Anatomy
close: this is the price in which the market is set to have close within a particular time frame
open: this is the price at which the market is said to have open within a specific time frame.
The high: this denotes the lowest price of an asset in the financial market at a particular period of time.
The Low: this denotes the lowest price price of an asset in the financial market at a particular period of time.
Conclusion
As a professional trader or an intending trader, its pertinent that you know and understand the workings of the Japanese candle stick so as to excel in the financial market. This is like the basic knowledge all traders needs to acquire before thinking of entering the financial market
#club5050 😀
@steemcurator02 my achievement1 needs to be verified.
Please help me