Steemit Crypto Academy Week 8 - Homework Post for @stream4u | by @adedapo-glory
Pivot point
Pivot point is a technical analysis tool that is used by traders in trading to get market movements. Pivot point is gotten by average of the data of the previous trading session such as the open price, the closing price and the high and low price of the previous session.
This tool is mainly used by intraday traders to get entry, stop loss and take profit points in a session. Whenever there is a trading above the pivot point that signifies a bullish trade and Whenever it is below the pivot point it signifies a bearish market.
Back when trading started becoming popular, the pivot point was calculated by the trader his or herself to determine the values he or she wants, but as time goes into a more advanced system, the pivot point can be gotten with ease as most trading platform has added it to part of their indicators that can be used.
Levels of Pivot point
The levels of pivot points are the lines set out as the resistance and support level.of the pivot indicator. Depending on the trader the me level of pivot point can be up to 5. But for this tutorial we will.be using three resistances levells and three support levels.
This levels are calculated by using the getting the average of the high price, low price and closing price of the previous session.
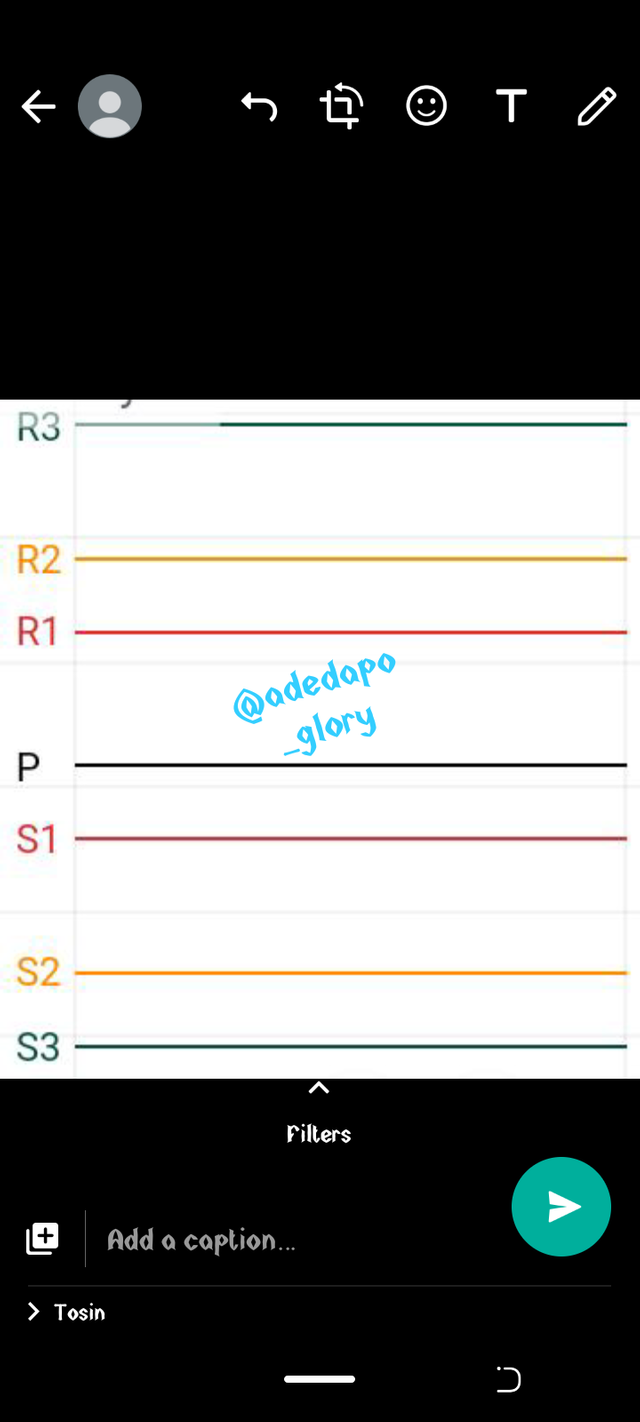
As seen in the screenshot above, when a pivot level is activated on the chart it will bring out the pivot levels.
The Resistance 1(R1),Resistance 2 (R2) and Resistance 3 (R3) are all resistance level(resistance level is the level a price reaches while increasing in price and bounced back to the reverse direction for sometime) of the pivot point.
The resistance levels can serve as a take profit 1, 2 and 3 of a trader depending on how he wants to place his trade.
The P is the main pivot point that helps to indicate a bearish or bullish market. When the price goes above the main pivot point that signifies a bullish market and when it goes below the main pivot point it signifies a bearish market.
The level Support 1(S1), Support 2(S2) and Support 3(S3) are the support level (level at which the price retracts back when there is a dip in the market). This levels can also indicate a reversal, entry point and a stop loss point for traders.
HOW TO CALCULATE PIVOT POINTS AND ITS LEVELS
To calculate pivot points and it's levels manually, there are formulas which one will use in other to get the calculations right.
The Formulas for Pivot Points:
Main pivot point (P)= high price + low price + closing price divided by 3
Mathematically, P = H + L + C /3
Resistance 1(R1) = main pivot point multiplied by 2 and subtracted by the Low price.
Mathematically, R1 = (P × 2) - L
Resistance 2 (R2) = main pivot point + (High price subtracted by Low price).
Mathematically, R1 = P + ( H -L)
Resistance 3 (R3) = (High price + 2) x (main Pivot Point – low price)
Mathematically, R3 = (H + 2) × (P - L)
Support 1 (S1) =(main pivot point multiplied by 2) subtracted from High price.
Mathematically S1 = (P ×2 ) - (H)
Support 2 (S2) = (main pivot point subtracted from High price subtracted from Low price.
Mathematically S2= (P - H - L)
Support 3 (S3) = Low price is subtracted from ((2 multiplied by High price) subtracted from Pivot Point).
Mathematically, S3 = L - (2 × H) - P
Above are the calculations for the pivot levels.
HOW TO SET UP A PIVOT POINT
To set up a pivot point indicator on a chart, one has to first get a chart reading site or platform. In this tutorial we will be using the tradeview platform.
Step 1
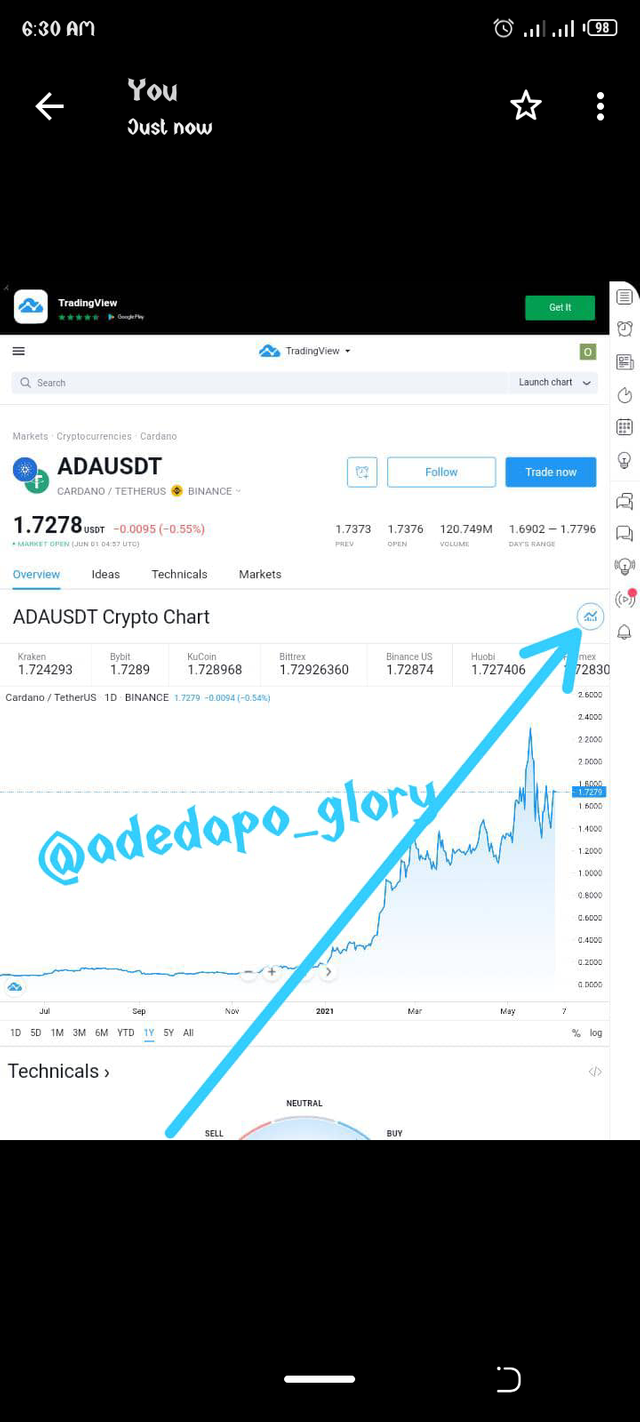
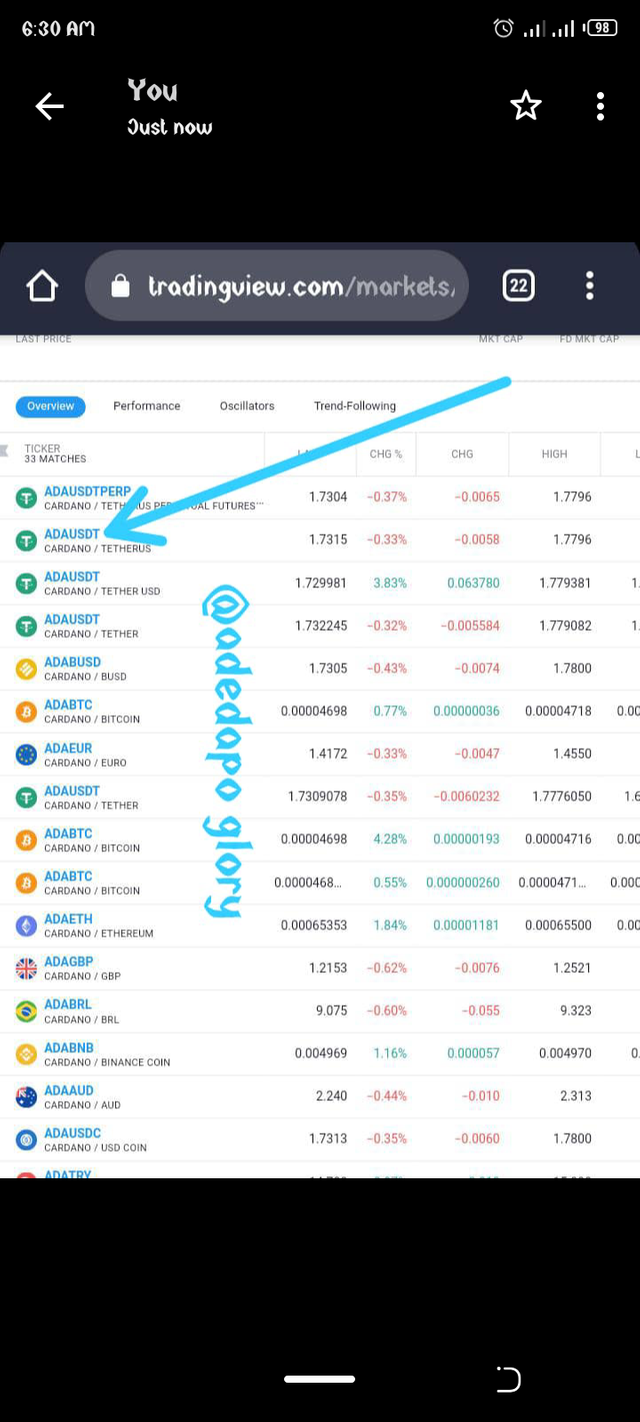
Load the site to get the pair you wish to trade on, after then you click on the pair, then click the chart icon to view the chart of the coin as shown in the screenshot below.
Step 2.
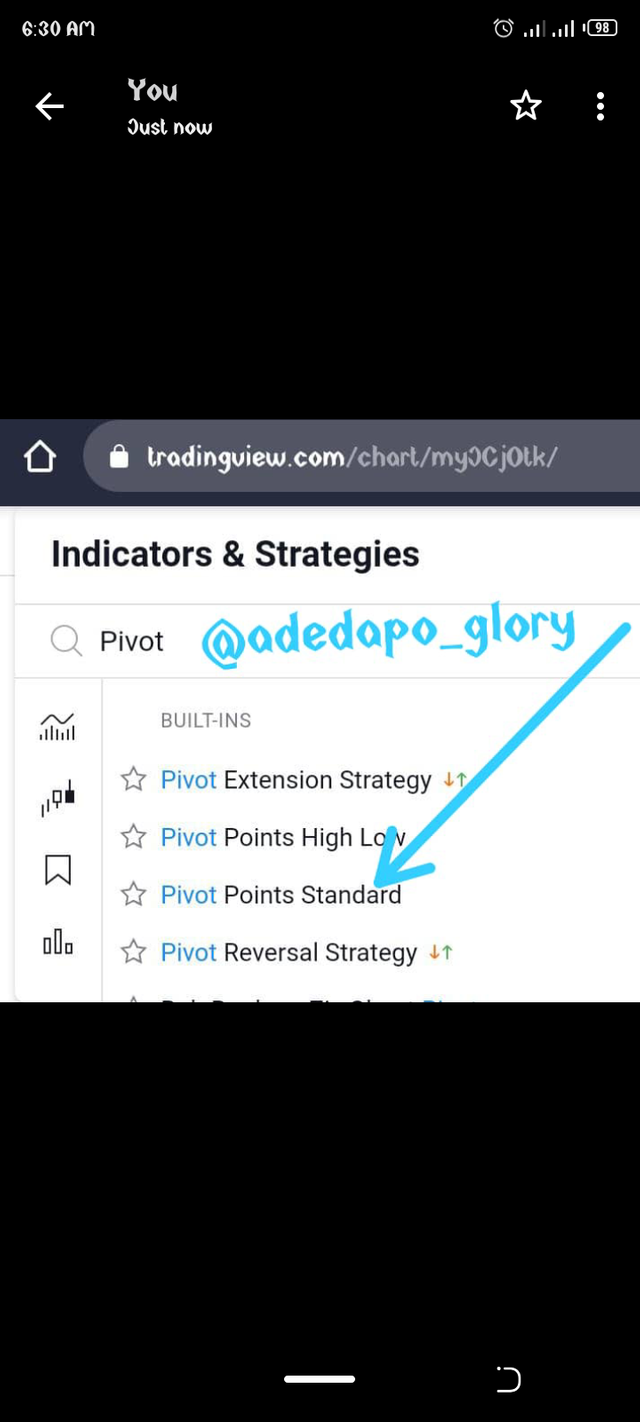
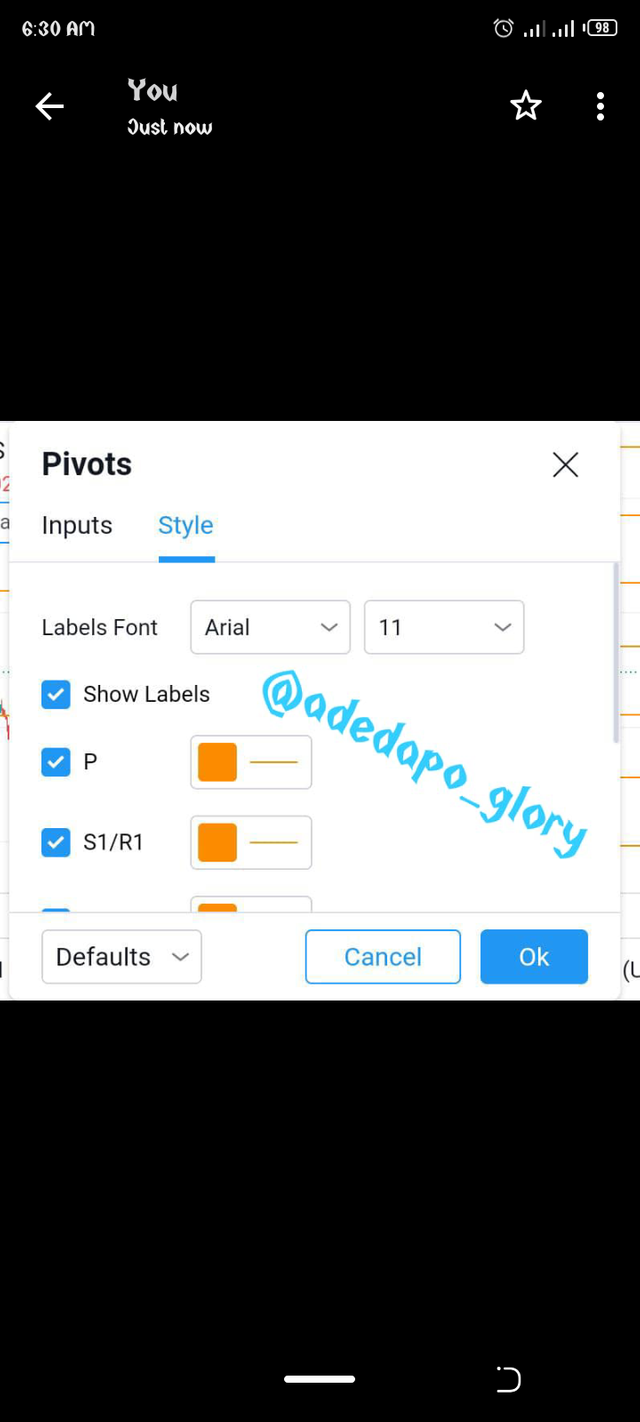
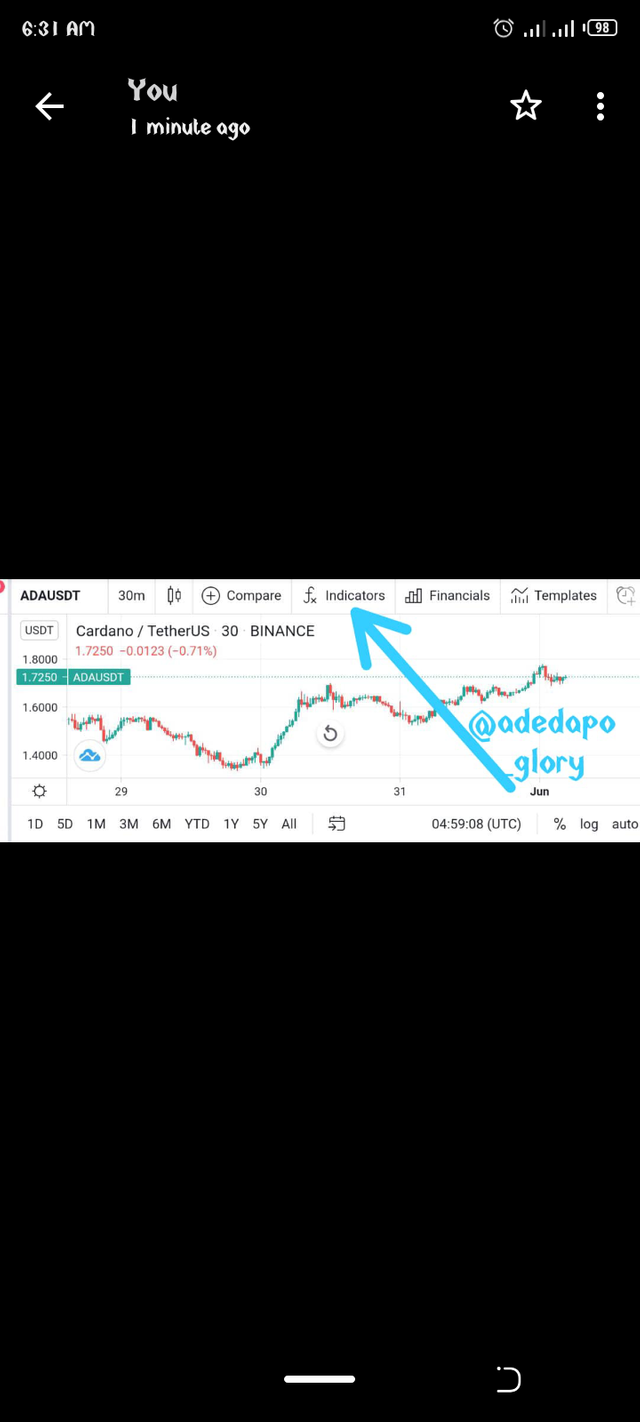
When the homepage loads, you then click on the indicator menu to get the pivot point indicator by searching for it on the search bar of the indicator interface, then click on the pivot point standard. To access the indicator on the chart. After clicking on it the pivot point shows on the chart. Then you modify the settings of the pivot point you then click on the settings logo to set the style and input as desired by the trader.
Step 3
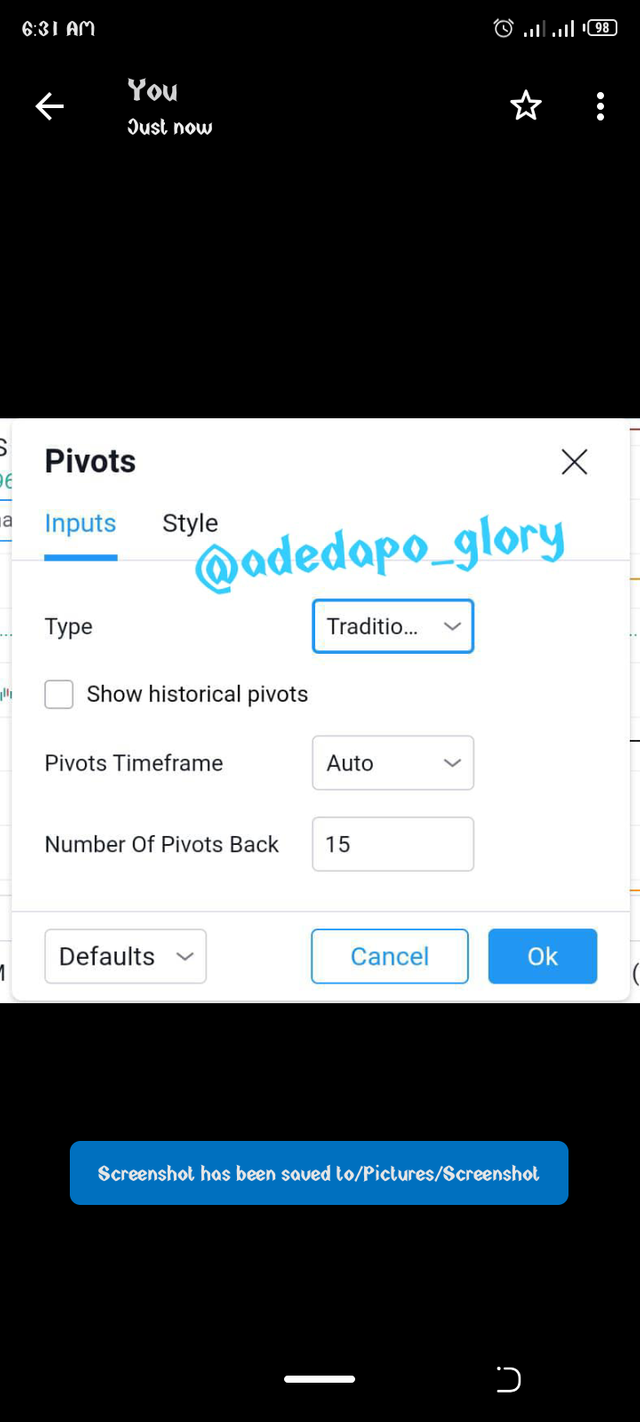
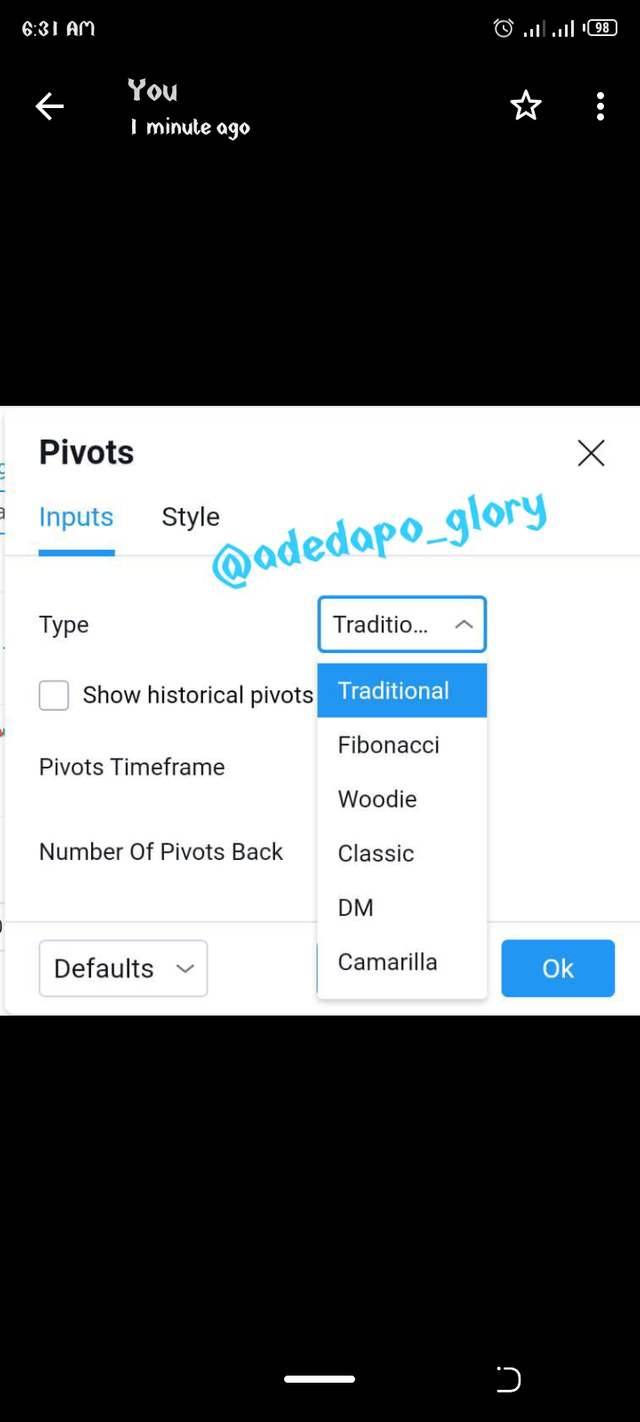
After the settings Is done one clicks okay and the new settings I'll be reflected. On the input interface one has the right to choose the kind of pivot point that is displayed, either the traditional pivot, cammarilla pivot etc. The difference is their calculations, which differs in the space between the levels of the pivot point.
HOW DOES PIVOT WORK
Pivot works by setting a entry point with the use of the main pivot point and sets both resistance and support levels. Each resistance levels and supports serves as a take profit especially for traders who take multiple profits on trades.
Whenever the market moves to a particular resistance level and doesn't retracts back then it will move up ahead and go towards the next resistance, if it goes above that also it will keep moving bullish towards the third resistance level and vice versa for the support level.
When the price goes a little above the main point it is a bullish signal and when it goes below the main point it is a bearish signal.
Pivot point Reverse strategy
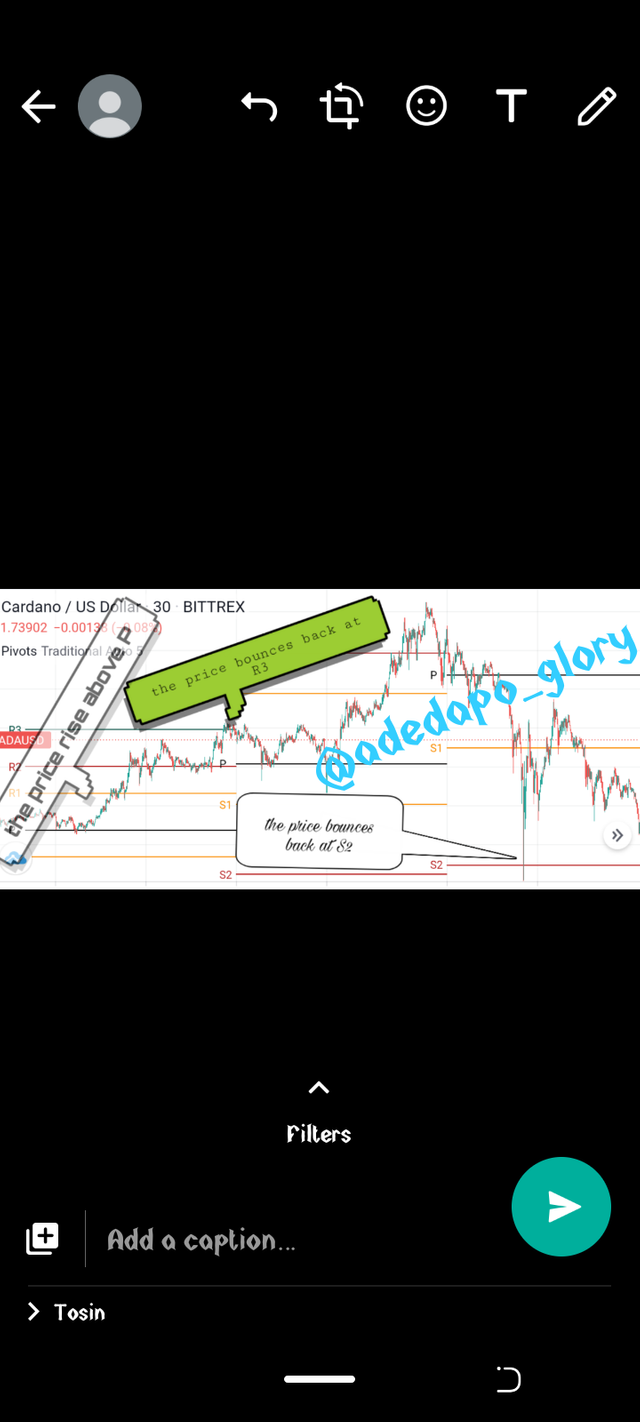
Reverse strategy is when the price gets to a support or resistance level and then retracts back to the opposite direction. Whenever the price of a coin hits the resistance level it is expected to retracts back and this is what is meant by reverse strategy. An example is cited in the screenshot below.
Common mistakes that occur with pivot point is depending solely on just the pivot point indicator without confirmation from other indicators. There are times where the price would go above the P and returns instantly below P to continue it's bearish trend.
Advantages
Pivot point is an indicator that can be used in all form of trading be it forex or crypto.
- It helps to set resistance and support which makes testing easier.
- It helps in taking profits in bit.
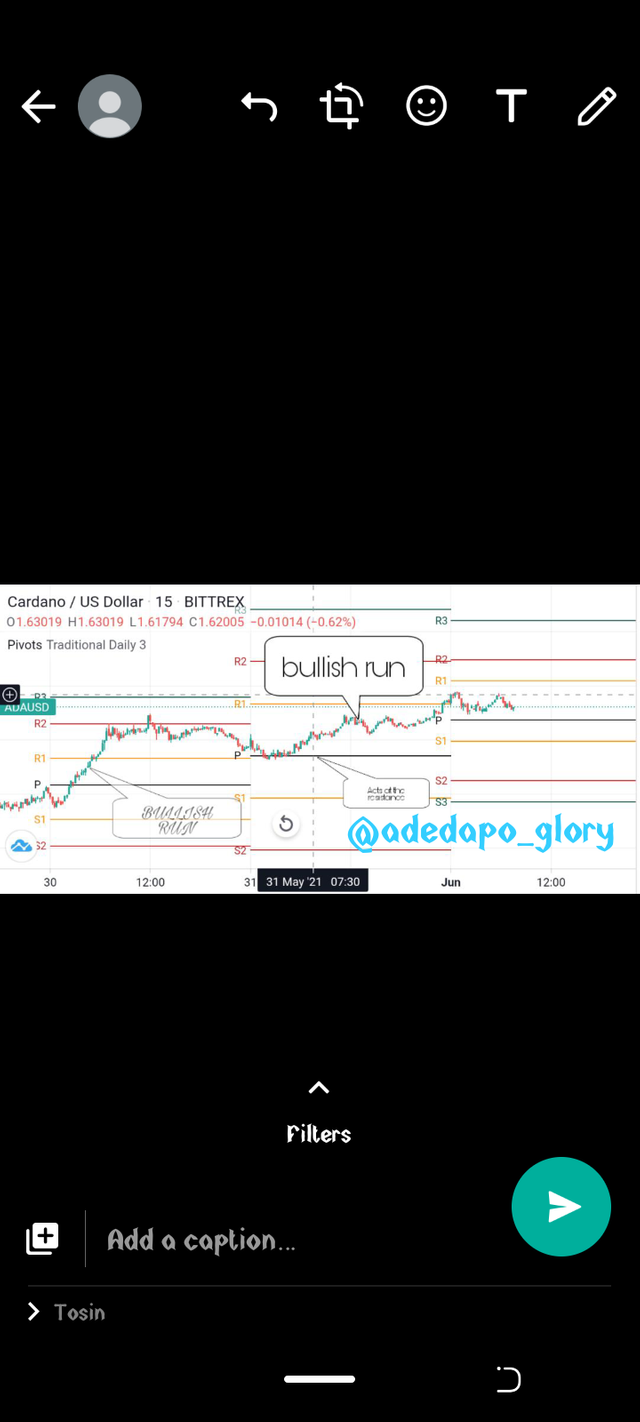
Chart analysis of Cardanousdt pair using pivot point.
The chart is for ADAUSDT, it has been on a bullish run in the last 24 hours. According to the chart after a bearish trend in between the main pivot and S1 support after which the price rose above the main pivot point, and has been on a bullish run going over R1 and stopped at the level R2 before reversing back and used R1 as support.
Then the next session started with the main pivot been at the same level with the previous R1and continues the bullish trend. The price rises and stopped at the new R1and rose above it a little, this bring the session to a close and continues again which is today's market. The bullish trend has continued and a new resistance is in between the P and R1.
There is a possibility for a retract in the market but a signal is needed, it needs for the price to go below P and then a trader can consider going short if other indicators has given certainty of the prediction.
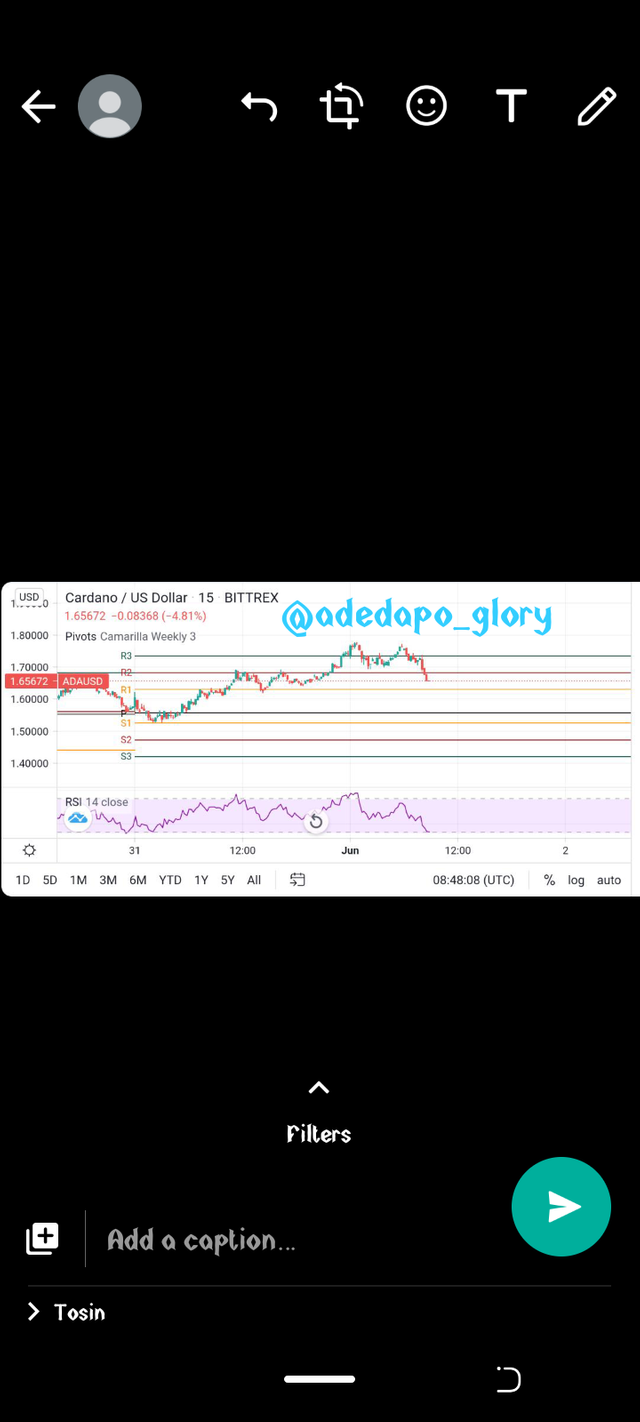
Weekly Price Forcast For Crypto Coin: CARDANO (ADA)
CARDANO which was founded in 2017 is a proof of stake blockchain which gives it's user audience to vote when there is need to change plans on the platform. The current price is at $1.67 and is presently ranked as #4 on coinmarketcap with a dominance of 3%.
It has a circulating supply of 31,948,309,411 ADA and a total supply of 45,000,000,000 ADA. It can be found on exchanges like binance, huobi, Okex etc.
I will be using the cammarilla pivot point to forecast the price of cardano for the next one week. The cammarilla allows for traders to take profits on time due to its smaller range of calculations. The current price of the coin is at $1.67 and as shown by the pivot point the lowest support level is at $1.30 which means for the period of this week the least value cardano can go is at $1.40 and the highest value is at $2.
The highest resistance for the cammarilla point is at $1.75, this is due to the close range of the points. So we will increase the resistance by a value of $0.25 and the support will be reduced by $0.25 as well to get a more effective prediction.
Hi @adedapo-glory
Thank you for joining The Steemit Crypto Academy Courses and participated in the Homework Task.
Your Homework Task verification has been done by @Stream4u, hope you have enjoyed and learned something new.
Thank You.
@stream4u
Crypto Professors : Steemit Crypto Academy
#affable