Technical Indicators 2 - Crypto Academy / S4W4- Homework Post for @reminiscence01

1a) Explain Leading and Lagging indicators in detail. Also, give examples of each of them.
Leading indicators are those indicators that give signals on potential price movements for a given trading pair or cryptocurrency market ahead of time. They help investors to understand the likely condition of the market and trends.
Leading indicators give traders an insight on the next step that they should take in order to minimise losses and maximize their profit. By getting the signals beforehand, traders can know when to enter and exit the market. However, there are some weaknesses of these indicators. Sometimes, leading indicators produce false signals especially in a trending market, where the market keeps moving in a particular direction without the formation of a new trend.
This means that traders who enjoy the insights given by a leading indicator should also be cautious of the vulnerability of such trend to false signals.
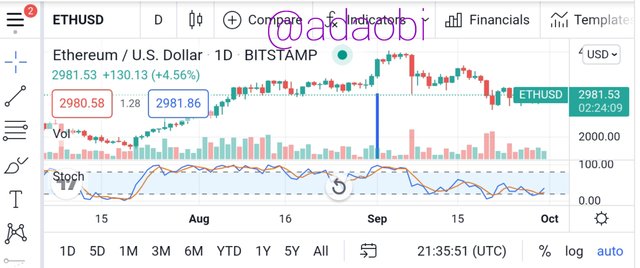
An example of a leading indicator chart is shown below.
Conversely, lagging indicators provide an investor with information about a market movement that has already started. They assess the current state of a market and send a corresponding signal to a trader.
Just like the leading indicator, lagging indicators also have some weaknesses. One of such is that an investor will miss out on the most important points like when to enter and exit. Stoploss in this sense will not be effectively minimized.
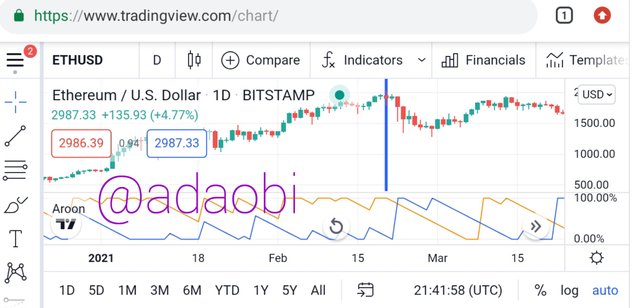
An example of a lagging indicator chart can be seen below;
1b) With relevant screenshots from your chart, give a technical explanation of the market reaction on any of the examples given in question 1a. Do this for both leading and lagging indicators.

From the screenshot above, the Aaron lagging indicator showed signals of downtrend after the downtrend had already started. The overbought and oversold were first seen in price movements.
Thereafter, the RSI indicator uses a thin line to show price movements. There was a huge bullish movement but the lag obviously showed that traders missed a first move. BTC price to USD stayed low a bit after which there was a little upward push.

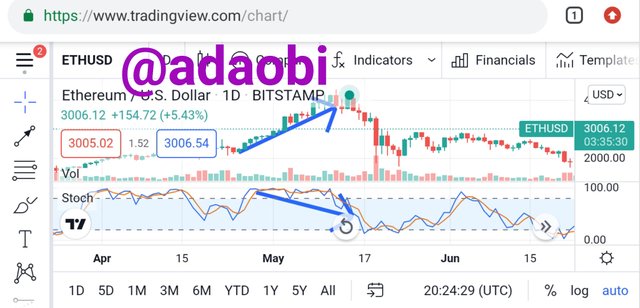
The leading indicator according to the chart above gave signals on Ethereum price movements before the actual price movement. There was a signal that price was going to kick up. The price movement was in line with the indicator signals. There was a reversal of price after the overbought signal.
2a) What are the factors to consider when using an indicator?
Factors to consider when using an indicator
1. Technical indicators are probabilistic in nature: Before using any technical indicator tool, understand that trends only give a probability of what may happen. They are not certainty tools. Most times, a trading pair may not always follow a particular trend, changes occur.
2. Your trading strategy: Above all, the trading strategies of a trader do matter. This will keep a trader above the predictions of the indicators.
3. Prevailing market movement: A market can either be trending or ranging. There are different indicators that best suit each prevailing market movement. For instance, moving average may work better for a trending market while the Donchain channels may best suit a ranging market.
4. Signal interpretation: It is also important to be able to interprete a signal gotten from indicators.
5. Confluence: Technical indicators are often better when used alongside other analysis. It is important to watch out for signals from other analysis tools to confirm technical indicator signals.
2b) Explain confluence in cryptocurrency trading. Pick a cryptocurrency pair of your choice and analyze the crypto pair using a confluence of any technical indicator and other technical analysis tools. (Screenshot of your chart is required ).
Confluence is the process of combining two or more technical analysis tools in order to get a confirmatory signal on price movements. Once the signals gotten from those indicators are confirmed by other technical analysis, it gives an affirmation of what the next market movement will be.
Confluence may be described as a trading strategy whereby a trader sets in motion, different technical analysis and indicators and also combine various trading signals so as to confirm how valid a trading signal may be. A trader may choose to combine Ichimoku, moving average or support and resistance to determine the validity of market signals.
As stated earlier, confluence is the act of using two or more technical analysis tools for a cryptocurrency pair.
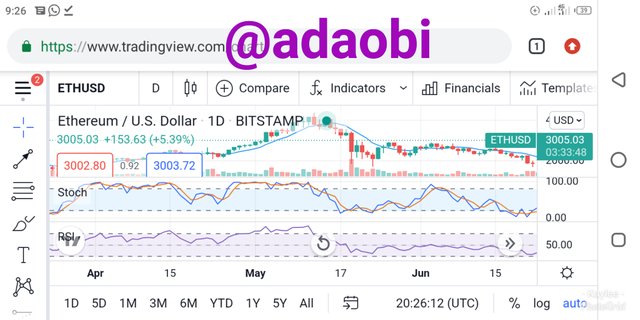
From the chart above, moving average, stochastic and RSI were used to get signals on ETH/USD. From the chart, it can be seen that in some price points, the signals gotten from the three tools complement each other.
A trader trading ETH will have some affirmation about the next step to take. According to the chart, ETH was in a bullish trend in May, a bullish signal was sent by both moving average and Relative strength index. In the same venn, there was a downward trend after the price crossed the moving average trend line. This downward trend signal was also seen in stochastic and RSI.
3a) Explain how you can filter false signals from an indicator.
How to filter false signals from an indicator
I) Use of confluence: A trader should always confirm signals gotten from other indicators/analysis tools to know whether to follow the signals or ignore it. The use of confluence will help an investor to filter false signals that may be sent.
II) Monitor the indicator: In order to filter false signals, a trader must monitor market movements and the way thatan indicator would react to that movement. This way, it would be easier to detect where and when there is a false signal.
III) A trader must also bear in mind that there exist false signals due to cryptocurrency volatility. This awareness will help the trader to filter some of the signals gotten.
3b) Explain your understanding of divergences and how they can help in making a good trading decision.
Divergence
This is a situation in which an indicator signal is in opposite or in contrast with real price movements of a market. An indicator may signal a bearish movement while there is a bullish price movement in real sense.
There are two types of Divergence; bearish divergence and bullish divergence. While bearish divergence is one in which an indicator is showing signals of a bearish trend but the market price is moving upwards, a bullish divergence on the other hand is one in which the indicator shows a bullish signal but the price movements show a downtrend.
Divergence help in preparing traders to get into a new trend as early as possible. For instance, a bearish divergence help prepare traders to take a short trade position while a bullish trend prepare them for a long trade position. Investors who understand this will use divergence as a tool for filtering false signals.
A trader can find a divergence and enter into a trading position at the time the price breaks the trend line. Divergences in a nutshell can help investors in their trading activities if only they understand them.
3c) Using relevant screenshots and an indicator of your choice, explain bullish and bearish divergences on any cryptocurrency pair.
Bullish divergence is a situation where there is a bullish signal given by an indicator while the real price movement goes in an opposite direction. Example of such is seen in the chart below.
An ETH/USD pair has its price movements going downwards while the stochastic indicator is showing an upward movement. This price and trend reaction is referred to as bullish divergence. This can sometimes be taken as a false signal, but it can also be helpful in trading.
Bearish Divergence
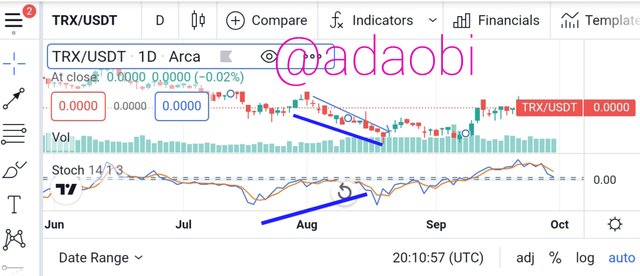
A bearish divergence is one in which the indicator is showing a bearish movement while the price is in a bull. This opposite moves can be seen in the chart below.
The TRX/USDT pair was in a downtrend while the indicator showed an upward move. This is known as bearish divergence.
Conclusion
Technical analysis is really important in cryptocurrency trading due to the volatility of cryptocurrency. But before embarking on the journey, it is really important to learn different tools of technical analysis and how they work. Technical indicators are great for analysis but they sometimes produce false signals. This is why it is very imperative to study them first before using them. Confluence is also an important aspect. It helps in confirming the signal of other indicators. In all, the trading skills and strategies of a trader matters in any successful trading activity.
@tipu curate
Upvoted 👌 (Mana: 3/6) Get profit votes with @tipU :)
Thanks
Hello @adaobi, i notice series of transactions from your account with @greatness96 who has been blacklisted in the academy. I also noticed you both share the same memo to transafer Steem to Binance.
Your account is suspected to be an alt account of @greatness96 to still participate in the academy.
I will like to hear your explanation on this case.
Greatness is a buyer. I used to sell my SBD to him long before he was blacklisted. It was easier because he pays in Naira. Besides, I have stopped selling to him. You can see that those transactions happened months ago.
Alright. Thank you for your kind response. The team will pass a judgment on this case and your post will be reviewed after proper investigation.
Hello @adaobi , I’m glad you participated in the 4th week Season 4 of the Beginner’s class at the Steemit Crypto Academy. Your grades in this task are as follows:
Observations:
I'm not satisfied with the charts you have provided on divergences. You can revisit the lesson to have a clear picture of divergences on the chart.
Recommendation / Feedback:
Thank you for participating in this homework task.
Thank you...
I'll do that