Trading Using Wedge Pattern - Crypto Academy / S5W5 - Homework Post for @sachin08.

Source

Wedge Pattern, just like other trading patterns has to do with a specific pattern of the crypto charts of assets. Wedge Pattern represents the convergence of trendlines, this happens because traders are deciding on the direction to send the market in.
When this happens, the market structure between the Wedge is constricted, meaning it's close together not making many Higher-highs or lower-lows, depending on the direction of the market.
There are two types of wedges, namely, Rising Wedge and Falling Wedge.
Rising Wedge, as the name suggests upward movement, means it happens during a bullish movement which signals the expectation of a bearish trend at the end of the Wedge. The illustration below shows a glimpse of how it looks like.
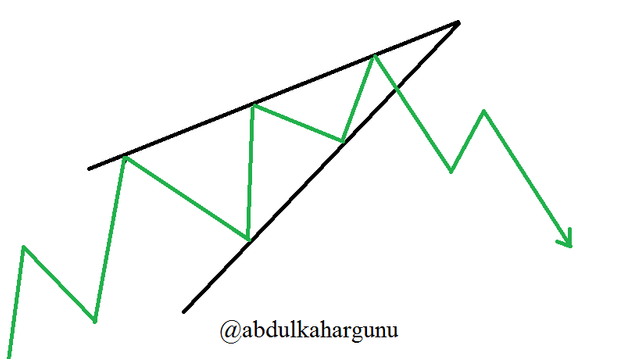 Designed by me
Below is how it happens in a real crypto chart.
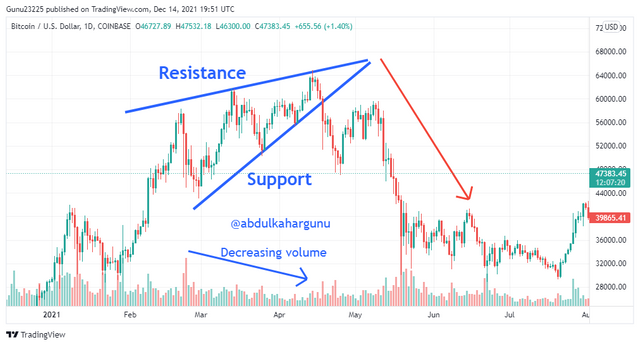 BTCUSD Rising wedge chart: Source
You can also note how the volume reduces with the Wedge.
Falling Wedge, as the name depicts downward movement, means it takes place in a bearish trend which results in a bullish trend at the end of the Wedge. The illustration below shows how it looks like.
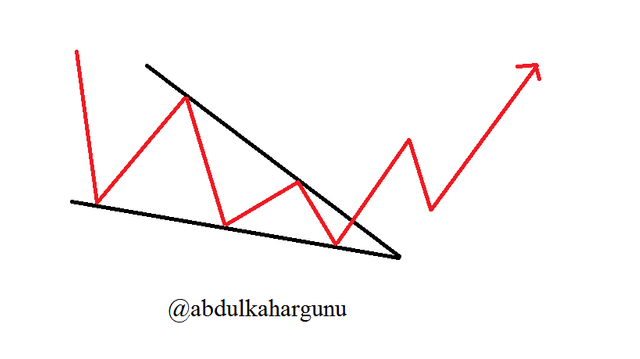 Designed by me
Below is how it happens in a real crypto chart.
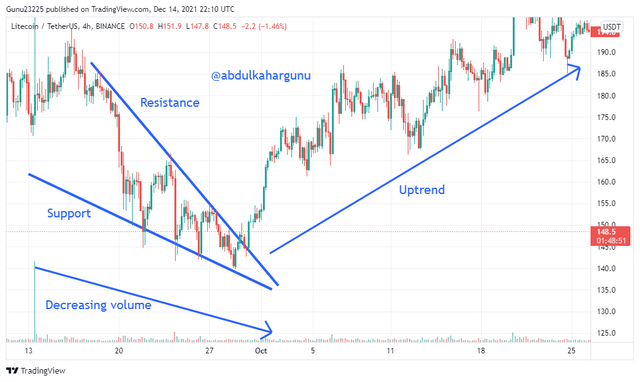 LTCUSDT chart: Source
You can also note how the volume declines with the Wedge.
2. Explain both types of Wedges and How to identify them in detail. (Screenshots required)
Identifying wedges in a real crypto chart isn't as easy as ABC, there are a lot of things that come into play when identifying either Rising or Falling Wedge respectively. This is how to identify both without much hustle.
With this wedge, though the name says rising, it ends up falling. This takes place during a bullish trend. When this happens, it means there's a high chance of a reversal.
To identify this Wedge, one needs to be able to distinguish whether it's an uptrend or not, I'll advise using the market structure method to find out so.
When the market structure is used and confined that it's an uptrend, then two lines are drawn above and below the chart making it look like an exposed triangle where the line above represents the resistance while the other represents the support. Let's check the chart below to have a clear view.
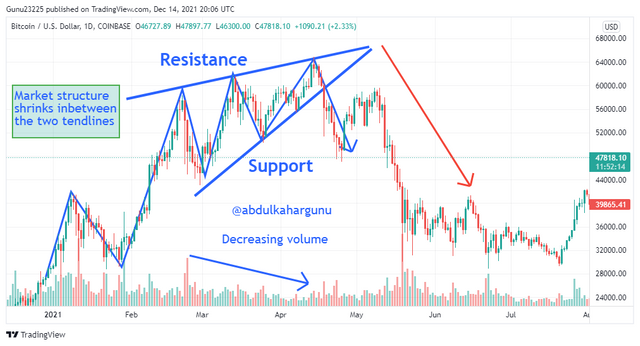 BTCUSD Rising wedge chart: Source
From the chart, you can see how the market structure behaves, the Trendlines, you'll realize it makes Higher-highs and Higher-lows but the Higher-lows are formed faster which makes it have a pointed look.
You'll also realize the volume decline in the process.
Important things to note is that, to identify a rising Wedge,
- It must be in a bullish trend, I recommend using the market structure approach.
- Draw two Trendlines, one up, the other down, which touches at least 5 places of the chart.
- Make sure to check the volume indicator to see whether it's declining or not, you need a declining volume.
- The market structure in between the Trendlines must be making Higher-lows faster in comparison to Higher-highs.
If a rising wedge happens during an uptrend, and Falling Wedge happens during a downtrend.
To identify this Wedge, one needs to be able to distinguish whether it's an uptrend or not, I'll advise using the market structure method to find out so.
When the market structure is used and confirmed that it's a downtrend, two lines are drawn above and below the chart making it look like an exposed triangle where the line above represents the resistance while the other represents the support. Let's check the chart below to have a clear view.
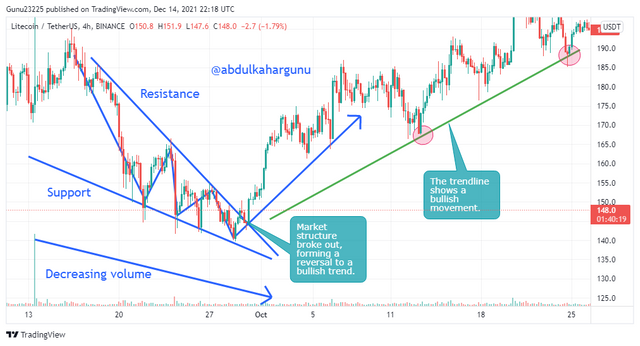 LTCUSDT Falling wedge chart: Source
From the chart, you can see how the market structure behaves, the Trendlines, you'll realize it makes Lower-highs and Lower-lows but the Lower-lows are formed faster which makes it have a pointed look. Also, during this process, you can realize the volume declining.
Important things to note when identifying and Falling Wedge is that,
- It must be in a bearish trend, I recommend using the market structure approach.
- Draw two Trendlines, one up, the other down, which touches at least 5 places of the chart.
- Make sure to check the volume indicator to see whether it's declining or not, you need a declining volume.
- The market structure in between the Trendlines must be making Lower-lows faster in comparison to Lower-highs.
3. Do the breakout of these Wedge Patterns produce False Signals sometimes? If yes, then Explain how to filter out these false signals.
Yes, it does give false signals sometimes. Using a pattern to identify and predict the direction of the market in the next hour or minutes might be simple to do but the question is how accurate the prediction will be.
In crypto trading, the charts will always show what's happening but not tell you that a whale or something is about to disrupt the market.
That's why it's advisable to use many indicators to analyze because an indicator might miss some points which another might not.
Using the Wedge Pattern, we might see the market moving the way we want it to but without paying attention to the movement. Let me explain what I'm talking about concerning the false signal of a rising Wedge below.
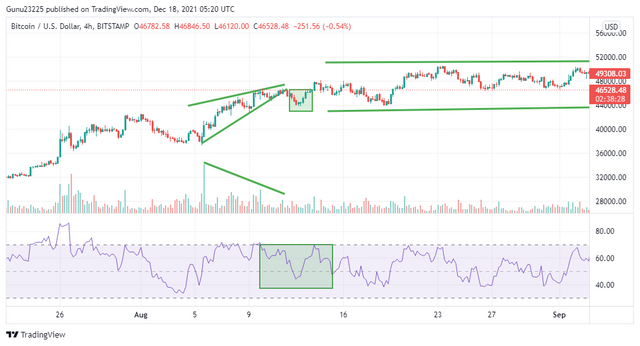 BTCUSD chart: Source
From the chart above, we got our rising Wedge, the volume too was declining, so it might spark a thought of that place being a potential profits zone. But here's the catch, with the introduction of the RSI indicator, we get a different view of the situation.
In the chart, we see how the price broke the Wedge and made attempts for a reversal, others might go into the market at this point without waiting or additional analysis.
With the RSI indicator, we see the downtrend but it shows a minimal one, not an extreme one, and the price retraces and then goes for a range. Others might get caught up in it because they just saw the break of the Wedge without adding any Indicator or analysis.
4. Show full trade setup using this pattern for both types of Wedges. ( Entry Point, Take Profit, Stop Loss, Breakout)
Once you've been able to identify the pattern correctly and choose to trade, this is a sample of how it can be done.
For Rising wedge, we need to enter the market when the prices have broken from the Wedge, need to make sure to minimize our losses as much as possible if there's going to be any, hence we set out stop loss at a price which is the same as the Higher-high before the breakout or slightly under it.
We then set out to take profit to a price we see fit but not a huge one. Let's use the chart below for illustration.
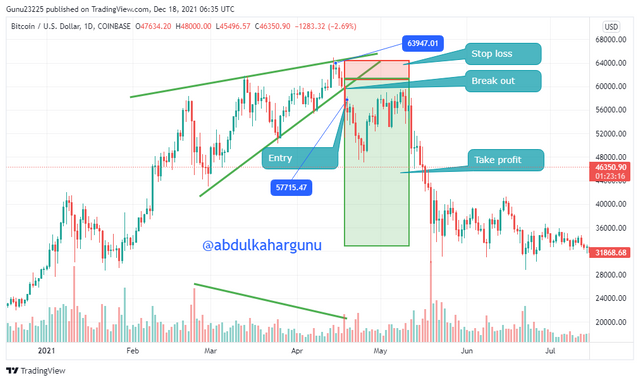 BTCUSD Rising wedge chart: Source
From the chart above, you see the stop loss has a price attached to it, this is an ideal stop-loss price we could use because it's the price of the Higher-high before the breakout. And we also set our entry point after the breakout. We then decide to take our profits at an appropriate price.
For Falling wedge, we need to enter the market when the prices have broken from the Wedge, need to make sure to minimize our losses as much as possible if there's going to be any, hence we set out stop loss at a price which is the same as the Lower-low before the breakout or slightly under it.
We then set out to take profit to a price we see fit but not a huge one. Let's use the chart below for illustration.
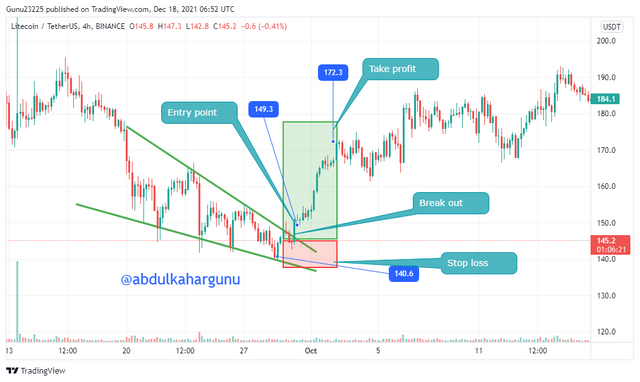 LTCUSDT Falling wedge chart: Source
From the chart above, you see the stop loss has a price attached to it, this is an ideal stop-loss price we could use because it's the price of the Lower-low before the breakout. And we also set our entry point after the breakout. We then decide to take our profits at an appropriate price.
Conclusion
As far as trading cryptocurrencies are concerned, finding the direction of the market will always be important as it will help minimize losses and enhance profits. A way to predict the possibility of reversal is by using Wedges. This is simple to use and understand but requires you to add Indicators to it to maximize the chances of your predictions.
Cc:- @shachin08