Reading Special Bar Combinations - Steemit Crypto Academy - S5W8 - Homework Post for @sachin08
Source

The bar chart is a trading chart type that works basically like all the other types of charts but its design is what makes it stand out.
It provides traders with information on how the market is moving and also shows the struggles between the buyers and sellers clearly because of how it’s formed. A trader can also adjust the time frame of it to have a better view of the market and can also do it in conjunction with other trading strategies. Let's look at how a typical bar chart looks like.
Designed by me
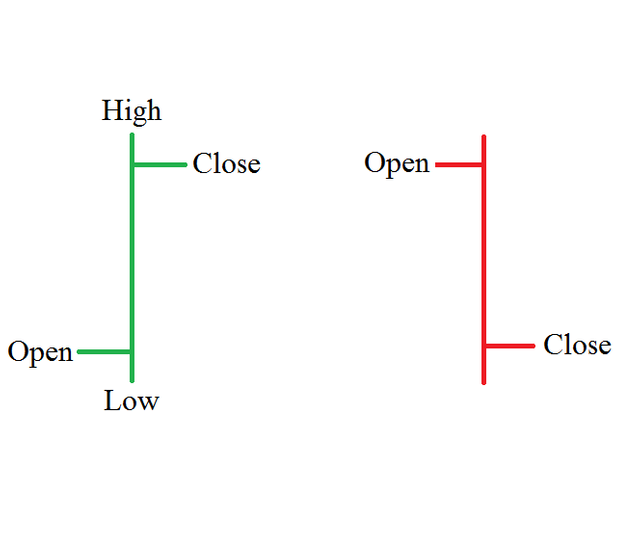
From the illustration above, you can see that a bar is a vertical line with the topmost part being the “High” and the bottommost part being the “Low”.
A green bar means an upward movement of price and also has an “Open” on its left side and a “Close” on its right side.
Likewise, the red bar represents a downward movement of prices and has an “Open” on its right side and a “Close” on its left side.
For every single bar, the open means the opening price for that particular bar, and the “Close” means the closing price of the bar.
The color of the bars is a result of price movement, this helps traders to see trends and price movements. If a bar has its close above its open, the bar is colored green meaning upward movement of price, and if the closing price of a bar is below its opening price then it’s colored red signaling a downward price movement.
The time frame of the bar chart can be changed, for instance, if you set the time frame to 1 minute, it means a minute in the chart is represented by a bar, likewise, if it’s set to a week, it means a week on the chart is represented by a single bar.
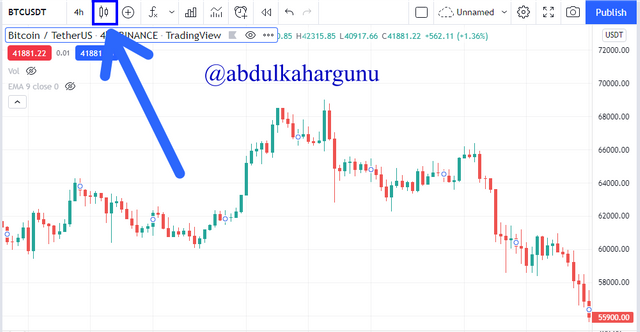
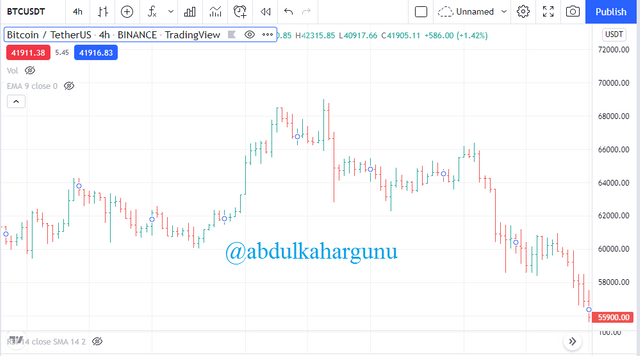
First of all, visit https://tradingview.com and choose an asset to use, you then click on the candles logo at the top left corner of the chart.
 Source
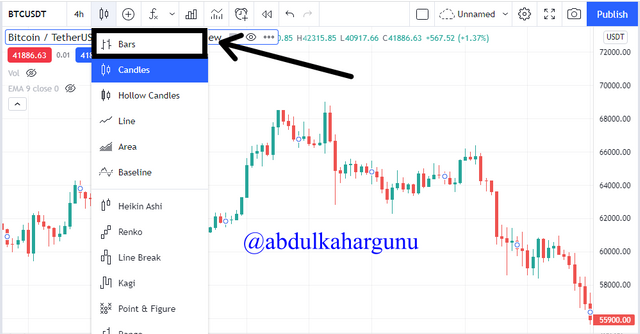
In the list of chart types that appear, choose Bar.
Source
There you have it, price Bars successfully added.
 Source
2- How to identify trends using Price Bars. Explain for both trends. (Screenshots required)
In identifying the trend using the bar chart, there are a few things we need to take note of.
Normally, we identify the trend of a chart by analyzing the higher-highs, Higher-lows, Lower-highs, and Lower-lows of the prices over some time.
Then, how do we find the Higher-highs and Higher-lows?
- Higher-highs are formed when a bar’s high is higher than the previous bar’s high.
- Higher-lows are formed when a bar’s Low is higher than the previous bar’s Low.
What of Lower-highs and Lower-lows?
- Lower-highs are formed when a bar’s is lower than the previous bar’s high.
- Lower-low is formed when a bar’s low is lower than the previous bar’s low.
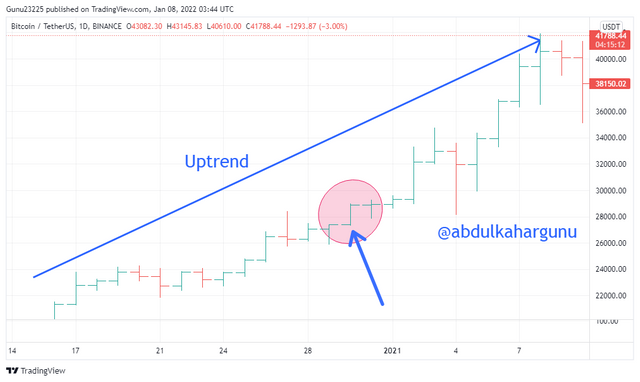
In identifying an uptrend, the most important thing is to check for the formation of higher-highs and higher-lows in the sense that, a higher-high must not be lower than the previous higher-high, and a Higher-low should not be Lower than the previous Higher-low. We can use the market structure to get a clear view.
In an uptrend, the bar chart looks as though is a stair that’s slanted and moving upward.
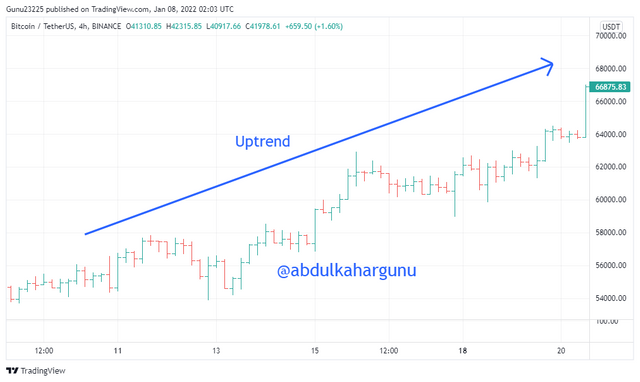 BTCUSDT Bullish Bar chart: Source
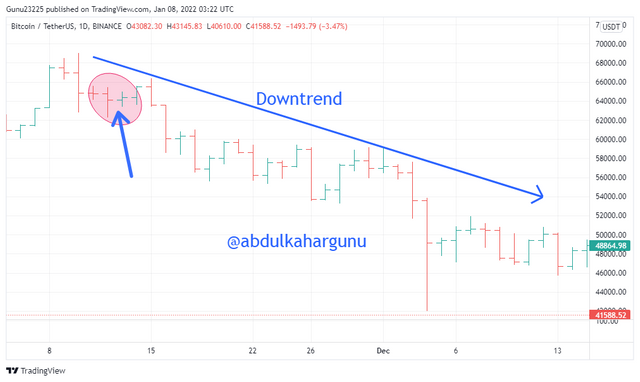
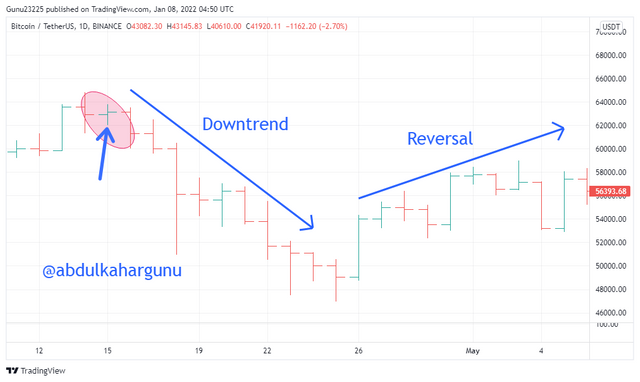
In identifying a downtrend, an important thing to check for is the formation of Lower-highs and Lower-lows in the sense that, a Lower-high must not be higher than the previous Lower-high, and a Lower-low should bo not be higher than the previous Lower-low. We can use the market structure to get a clear view.
In a downtrend, the bar chart looks as though is a stair that’s slanted and moving downward.
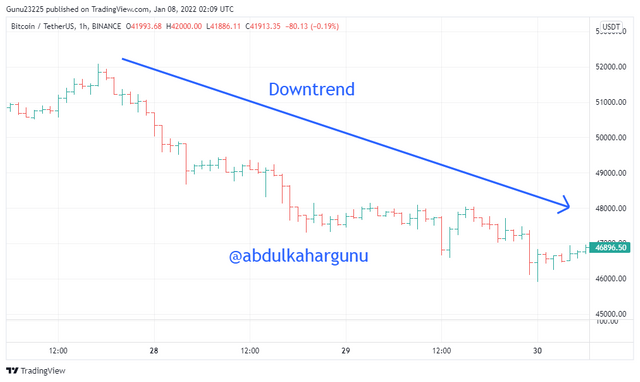 BTCUSDT Bearish Bar chart: Source
3- Explain the Bar Combinations for Spending the Day inside for both conditions. (Screenshots required)
As far as reading charts are concerned; there are always some signals or patterns that people are always on the lookout for to make their conclusions on signals.
When it comes to Bar chart, there are these signals too, let's take a look at them.
For a bullish trend spending the day inside means the indecisive nature of the traders. This usually sends signals of a possible change in trend.
This happens between two bars, It is formed when a High of a particular Bar is higher than that of the next Bar, also its low is lower than that of the next bar.
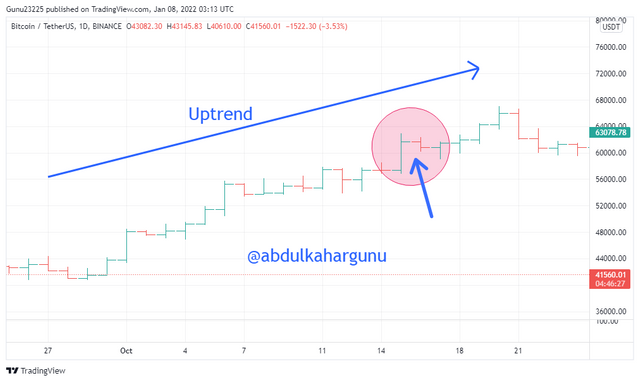 BTCUSDT chart: Spending the day inside for Bullish trend Source
From the above chart, you see how the bars at the highlighted place behave.
In a bearish trend, it is formed when the low of a Bar is seen to be higher than that of the previous bar’s low and its high is seen to be lower than that of the previous one’s,
 BTCUSDT chart: Spending the day inside for Bearish trend Source
4- Explain the Bar Combinations for Getting outside for the Day for both conditions. (Screenshots required)
This combination is formed when a bar’s high and low range exceeds that of the preceding bar. When this forms, it gives a strong impression of the possibility of a trend change.
The formation of outside day to signal a bullish trend happens when the opening of a bar is at its low and the close at its high. This shows how traders have made the prices go high to the extreme of that bar, hence a possibility of an uptrend.
 BTCUSDT chart: Getting outside for the day, for Bullish trend Source
The formation of getting outside for the day to signal a bearish trend happens when the opening of a bar is at its high and the close at its low. This shows how traders have made the prices go high to the extreme of that bar, hence a possibility of a downtrend.
 BTCUSDT chart: Getting outside for the day, for Bearish trend Source
5- Explain the Bar Combinations for Finding the close at the open for both conditions in each trend. (Screenshots required)
Close at the open is a phenomenon where the open and close of a bar are either at the direct opposite of at the same point or close together. The place of the formation can help in the deduction of the direction of the market.
In identifying an uptrend or a continuation of an uptrend, the open and close bar must almost align with each other or align completely and should also form near the high of the block to signal a trend reversal to a bull direction or an indication of trend continuation.
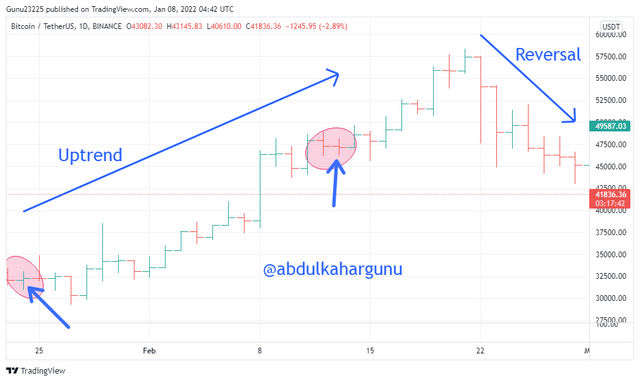 BTCUSDT chart: Close at the end for a Bullish trend Source
As I mentioned earlier, the formation of the open and close and the position of it is what signals a possibility of a reversal or a trend continuation.
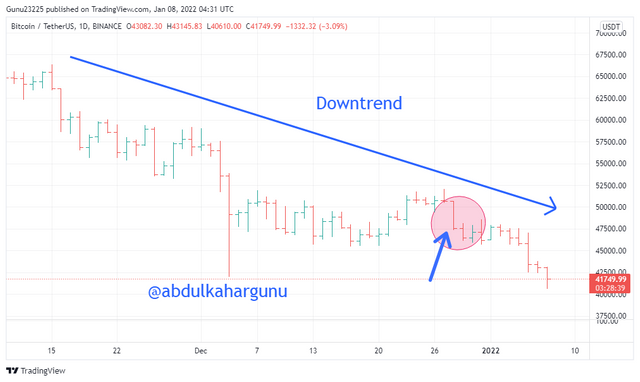
In a downtrend, the open and close are formed close or aligned together and positioned at the close or the low of the bar
 BTCUSDT chart: Close at the end for a Bearish trend Source
Reading the market charts requires the use of many strategies to be able to gain a concrete signal. Its also a good thing to employ other charts types so you can confirm signals.
In this post, I have explained the use of Special bar combinations to enable a trader to a different view of the market which will go a long way to boost the success rate of a trader.
I thank prof @sachin08 for the insights in this lecture.