[Effective Trading Strategy using Line Charts ]-Steemit Crypto Academy | S6W1 | Homework Post for @dilchamo
Designed by me

With cryptocurrencies, there's always going to be buying and selling of assets and since the cryptocurrencies are decentralized, it means its price isn't dictated by a central bother but by what is called Demand and Supply.
Since this is what influences the prices of cryptocurrencies, it is only reasonable if a person can have a way to get the historical data of crypto and study to get some level insights to gaining the future direction of the price of an asset.
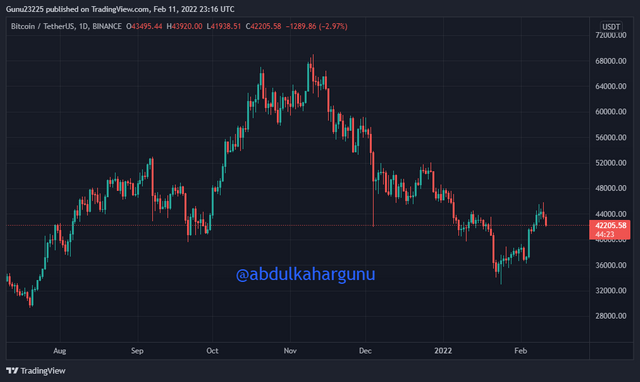
A way to analyze this data is by using the Line Chart, it's a 2D graphical representation of the change in prices of an asset, this chart makes use of lines to connect various parts of the chart. The open and closing price over some time is connected with a line. Since buyers and sellers are always changing the direction of the market, a line chart might appear to be in a zigzag form.
Also, the way the Line chart appears depends on the time frame a person sets it to, meaning the way it appears is not constant.
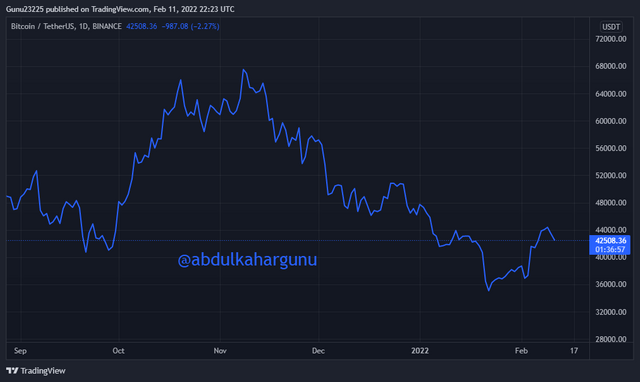 BTC/USDT Line Chart: Source
Being able to use line charts comes with obvious benefits, from being able to understand market trends to use it in conjunction with technical indicators to identify potential entry and exit points to maximize profits and reduce possible losses that may be incurred.
There are always patterns of the crypto chart that people seek to find, some of such are the support and resistance lines.
During a support period, we'll tend to see prices of an asset trading above a price, and even if the price moves down to it, it bounces off the price.
In simple terms, this means the buyers of the asset are making sure the price of the price doesn't drop down past a specific price.
This way when a support line is drawn, the prices are seen to trade above it.
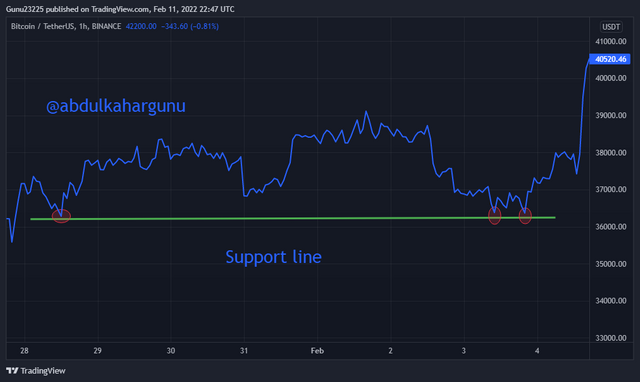 BTC/USDT Support: Source
During a Resistance period, we'll tend to see prices of an asset trading below a price, and even if the price moves up to it, it bounces off the price.
This is as a result of the sellers of that asset affecting the market such that the price of the asset doesn't rise past a specific price.
If a Resistance line is drawn, you'll see that prices will be trading below the line and at times trying to bypass it, it either fails to bypass the line and bounces off it to continue the trend or could break it and attempt a trend reversal
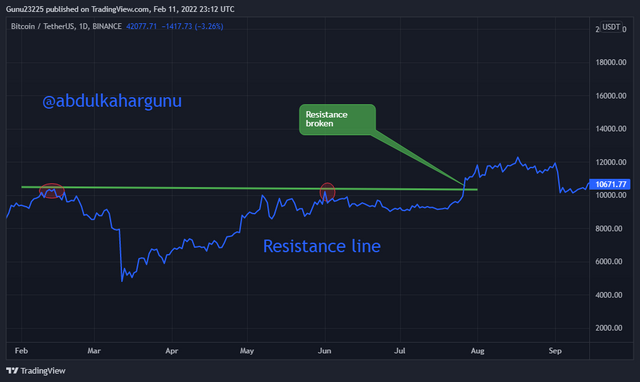 BTC/USDT Resistance: Source
Since the Line chart connects points of the market, it is only reasonable to say it should be employed when analyzing a wider range of time as it leaves much information out.
The Japanese candlestick pays attention to many details of the crypto chart which makes it preferred when analyzing over a small time frame.
 BTC/USDT Candlestick chart: Source
Looking at the Candlestick chart above, one will find that it pays attention to the open and close of the prices. The color representations also talk about the traders controlling the movements of the market.
In reading a crypto chart, it is always advisable to use other technical analysis tools to get the best results. I prefer using the EMA indicator and RSI indicator.
The EMA indicator can be used to identify trends and possible trend reversal. It is represented by a line on the chart where prices can be traded below or above it. If prices are seen to trade above it, it means a bearish movement and if prices trade below it, it's bullish movement.
How high the prices are trading below or above the moving average shows the strongness of the trend.
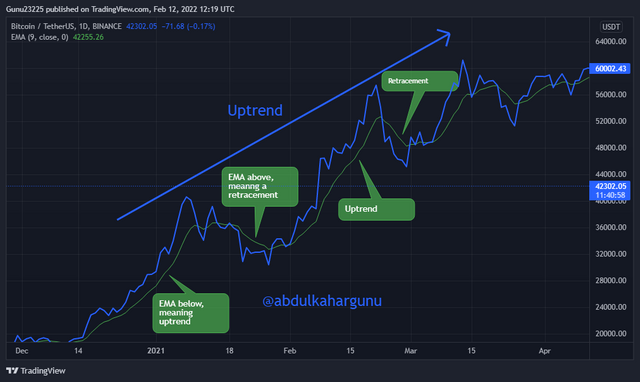 BTC/USDT Line chart with EMA indicator chart: Source
The RSI makes use of the buying and selling power of crypto traders. Using this indicator is simple as you check the mark of the market. If the RSI indicator reads that prices are over seventy(70) it means the asset is overbought and hence a reversal should be expected. Also, if the RSI moves below thirty(30) then it means the asset is oversold and a reversal should be expected.
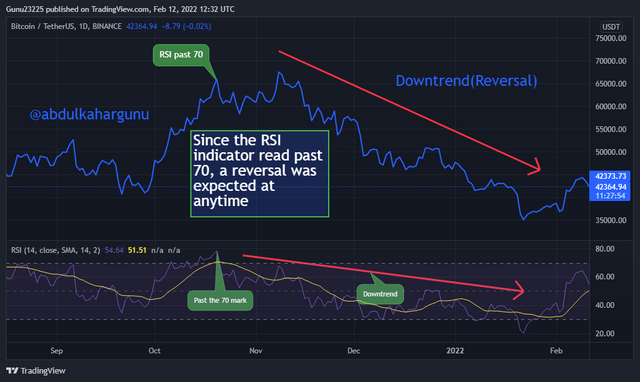 BTC/USDT Line chart with RSI indicator chart: Source
using Line charts.
In finding entry points into the market, it is important to find the trend of the market and to use other technical analysis tools to get a suitable position.
To get a bullish trading opportunity, I use a falling wedge in conjunction with the line chart and the Volume indicator.
In using a falling wedge, two trendlines(upper and lower trendlines) are drawn in the form of an open triangle, it is important to know that it is formed during a downtrend. in the wedge, the prices of the asset will appear to make contact with both trendlines.
It is important to know the fact that the upper trendline is called the resistance and the lower one is called the support, In the wedge, Prices will appear to be congested toward the end of the wedge.
The wedge is used to spot a possible trend reversal when the prices break free from the wedge at the end of it.
If a falling wedge appears, the volume indicator reads its value to be decreasing.
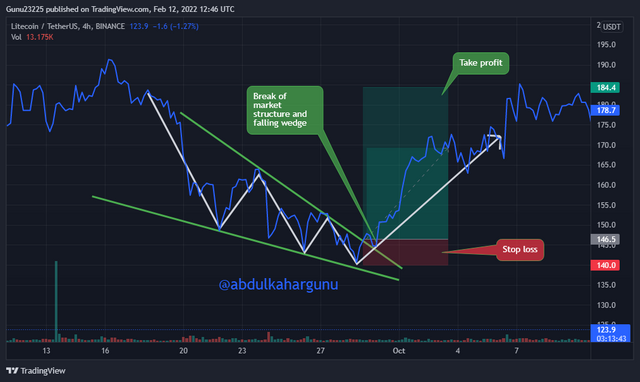 LTC/USDT Falling wedge: Source
To get a bearish trading opportunity, I use a rising wedge in conjunction with the line chart and the Volume indicator.
A rising wedge is the exact opposite of a falling wedge, it takes place during a bullish trend and also has the same setup as the falling wedge.
The volume reduces with the appearance of a rising wedge.
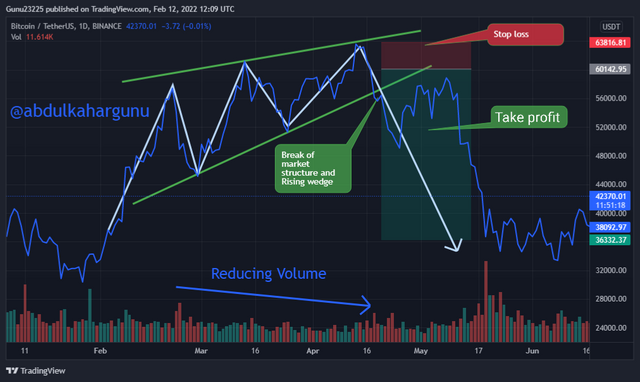
BTC/USDT Rising wedge: Source
The Line chart is easy to read and analyze as it looks for simplicity. Since it connects closing prices with a line, it gives a simplified meaning to the reader.
Another advantage it has is the fact that it displays the relevant information and leaves out some details that might not be of use to the reader.
Also, it makes the identification of trends simple and does not need much hustle to do so, support and resistance lines are also easy to spot because it's in a 2D graphical representation.
Another advantage is the fact that it displays the chart clearly and is easy to be Integrated with other indicators for a better understanding of the market as it does not congest the chart.
As it has advantages, there are bound to be disadvantages too.
The first disadvantage is the fact that it leaves out many information which is very important for chart analysis, for instance, one can not determine the buying and selling of the market because high one low of the prices can't be determined hence it's difficult to predict the next market movement with high accuracy.
Also, it's not suitable for short time frame analysis as it's good for wider time-frame, it causes a lot of loss to users who need relevant information to make trades in a short time.
In reading crypto charts it's important to know the fact one might not get all the relevant information in a particular chart and can only use other chart representations to get them.
The line chart is easy to read and gives a clear representation of data and also doesn't incorporate much irrelevant data. It is good wide time frames and short time frames too. It can be used with technical indicators too without hustles and gives distinguish display.
I thank professor @dilchamo for this lecture.