Confluence Trading - Crypto Academy / S5W6- Homework Post for @reminiscence01

Source

In crypto trading, the market direction is always the make or break of every trader. You could gain a lot by getting the market direction right or running at a loss. It all boils down to how correct the signal or trend is, however, you can never be too sure what will happen in the 5 or 10 minutes, that's why there’s confluence trading.
This means using different strategies or patterns to confirm a particular market signal. This act is called confluence trading, where you try to confirm a signal using different strategies.
One could use different trading indicators at the same trying to confirm a signal with other trading patterns. The number of strategies you employ would determine the level of confluence you’re using. If you use at least 2 different strategies then it means a level confirmation confluence, at least 3 strategies correspond to level 3 confirmation confluence.
The benefits of this confluence trading go without saying, just as you would use different formulas in the exam hall just to confirm your final answer.
To make a trade setup, we first choose the strategies with which we ate conversant, to maximize our chances of getting the right analysis.
First, we choose the asset which we want to work on, we then determine the direction of the market with a strategy we desire, in my case Market Structure.
With this method, we will observe the prices making higher-highs and Higher-lows in case of an uptrend and the prices making Lower-highs and Lower-lows in case of a downtrend.
Once the direction is determined, we add the RSI indicator to make further analysis of the trend. Because, once a market is in a certain direction, you can never be too sure how long it will stay there and the direction it would take later, might be a reversal or the prices might go to a ranging phase where the prices are moving in an equal manner, no much bull and bear. Let's look at the chart below for more clarification.
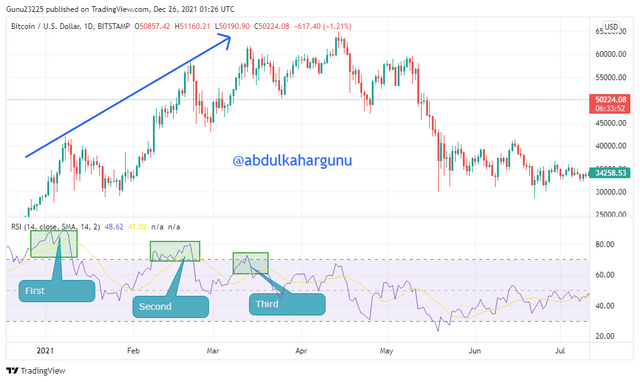
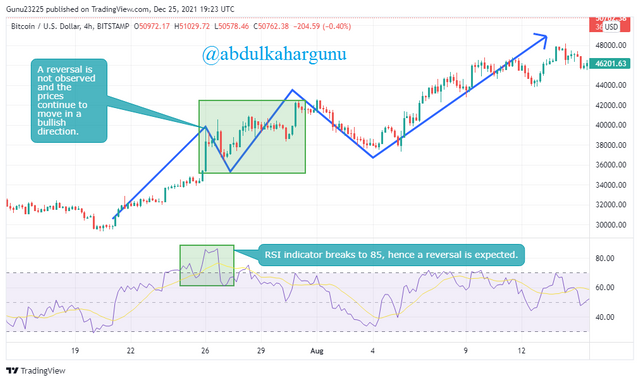 BTCUSD chart: Source
From the chart above, we were able to determine the direction of the market with the market structure approach, but because we want to get more information concerning it, I added the the RSI indicator to the chart.
However, we see that the part of the RSI indicator reads that the asset has been over brought and reads a mark of moreover than 85, meaning we should expect a trend reversal.
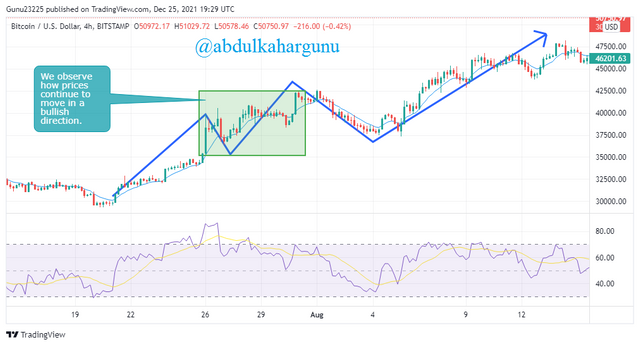
But the reversal does not take place as we still see the prices moving upward, so this brings about the confusion here. So we employ another indicator called the EMA indicator to get the market from a different angle.
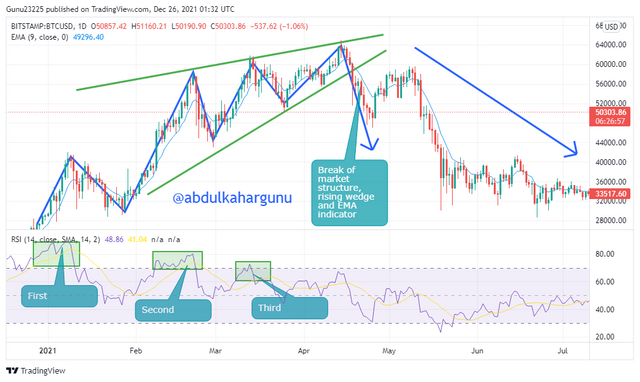
 BTCUSD chart: Source
The chart above is what we had after the introduction of the EMA indicator, we now see that the prices maintain their form and keep moving forward, we see how the prices are trading above the EMA which signals a bullish movement. This means that the RSI indicator gave us an invalid signal.
2. Explain the importance of confluence trading in the crypto market?
Crypto trading comes with a lot of variables, you can never be too sure, hence the need to make more analysis of the charts, these bring about of benefits which are listed below.
- Everyone goes into crypto trading because they want to earn it, the employment of confluence trading makes this a lot easier, it makes sure the trader has a deep insight of the current market and be able to make a good and effective decision that will best suit the current market.
- Furthermore, it gives traders a sense of management, this means that it boosts a person's risks management. Let's say you analyze the market with confluences and you finally decide what to do, it makes you be able to predict not only your profits but also take care of any loss which might occur since the market is volatile.
- Also, it broadens a trader’s horizons, it makes traders be able to find new ways to read the charts and also find assets that will best fit their interests. Since some traders prefer a highly volatile cryptocurrency, with the help of confluence trading, one can analyze and filter out there are cryptocurrencies.
- Another thing confluence trading does is that it's able to give traders confidence in whichever decision they choose to make. If you read the charts backed up with other strategies that have proven to have a higher chance of success, it gives you the confidence to go ahead with the trade, because once you hesitate and the chance moves away, you might have to wait till you see a favorable entry point, which might not happen anytime soon.
3. Explain 2-level and 3-level confirmation confluence trading using any crypto chart.
Confluence trading involves the employment of many strategies in the analysis of a chart, the numbers r of strategies employed determine the level of confluence trading you're using, below is the explanation of the levels involved.
In this level, we employ trading strategies to try very the movement of the market, we use an indicator and a trading pattern, namely, EM and falling or falling wedge respectively, it's not a must to use these two strategies but use strategies you're conversant with. First, we apply any of the wedges (in my case), analyze them then add the indicator to conclude our findings. Let's take at the chart below for clarification.
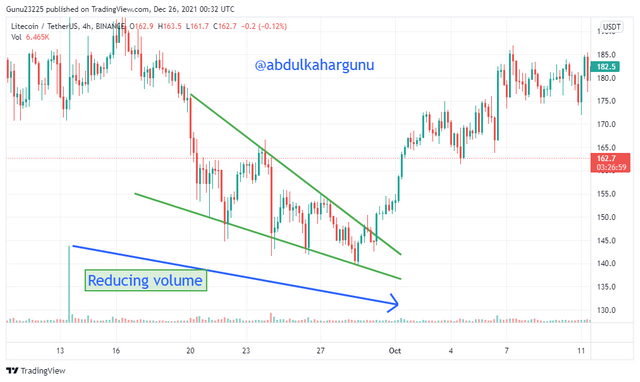 LTCUSDT Falling wedge chart: Source
From the chart above, I employed a falling wedge which takes place during a bearish trend, inside the wedge, prices make touches to both the upper trendline and lower one respectively.
The upper trendline represents the resistance while the other trendline represents the support, you'll realize that the more the chart moves into the wedge, the smaller it becomes. When a wedge is used, it is expected that when the price breaks the wedge at the end, there's a high chance for a reversal. Also, when a wedge takes place, the volume is usually reduced with the wedge. so with this in mind, I add the EMA indicator to help me get a more concrete resolution.
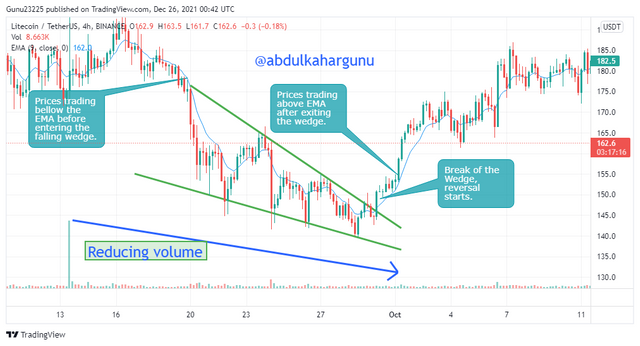 LTCUSDT Falling wedge chart: Source
With the introduction of the EMA indicator, we're able to confirm our hypothesis since it shows how the wedge broke to reversal. We can also see how prices were trading above the EMA line indicating an uptrend.
For this level, it involves the use of 3 or more strategies in the analysis of an asset. I will be using the Rising or Falling wedge, RSI indicator, and EMA indicator. I will be adding them one by one so that we have a clear analysis. Let's analyze the chart below.
 BTCUSD Rising wedge chart: Source
From the chart above, I added the RSI indicator first, and from the look of things, on the RSI indicator, the first rectangle is in an overbought phase hence, a reversal is to be expected, but, the chart doesn't seem to be reversing but still moving in an uptrend.
The second rectangle also shows an overbought signal yet the market is still in an uptrend, the same applies to the third rectangle. This situation is very confusing, so I draw a rising wedge since it's in an uptrend and add the EMA indicator to better analyze the situation.
 BTCUSD Rising wedge chart: Source
In the chart above, I needed to have a clear picture of the market movement hence I used the market structure approach and found that the market was in a bullish direction, since the RSI indicator was confusing, ai thought of the possibility of a reversal any moment hence I add the Rising wedge to see if it fits, and it fit the situation, perfectly.
For the last confirmation, I added the EMA indicator. After I added all the strategies, you see how the Market structure inside the rising shrinks to the ending part of the wedge. The EMA indicator also shows the prices are trading above the EMA line
The price finally breaks from the were and Market structure at the ending part of the wedge, the EMA indicator also how's prices trade below the EMA line. A reversal is observed.
4. Analyze and Open a demo trade on two crypto asset pairs using confluence trading. The following are expected in this question.
a) Identify the trend.
b) Explain the strategies/trading tools for your confluence.
c) What are the different signals observed on the chart?
To be able to analyze and get a good buy signal, I decided to analyze ETHUSDT pair.
a) To identify the trend of the pair, I use market structure and incorporated a falling wedge to it I then added the EMA indicator to get a more in-depth look. I found out that the market was initially in a downtrend then recently broke from it and attempted a reversal.
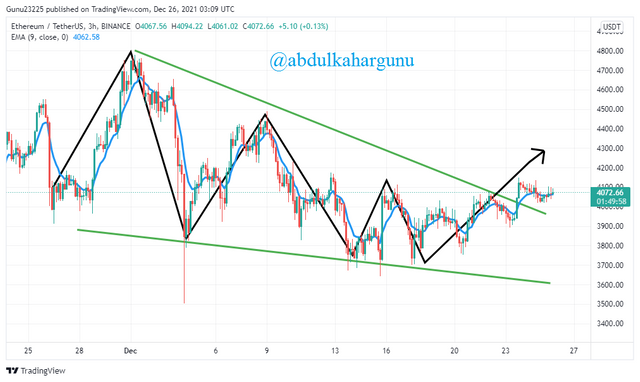 ETHUSDT Rising wedge chart: Source
b) I employed the market structure approach to get the direction of the market and then draw a falling wedge since the Market is in a downtrend as per the market structure so that I can try to find a possible breaker of the market structure and the falling wedge.
I added the EMA indicator to find possible entry points and filter out false breakouts. I then find the breakout point right after the wedge and market structure is broken.
c) From the analysis gotten from the chart, the prices have broken from the previous trend and are now in a possible reversal. The EMA indicator gives a strong buy signal right after the break as the prices are trading above it.
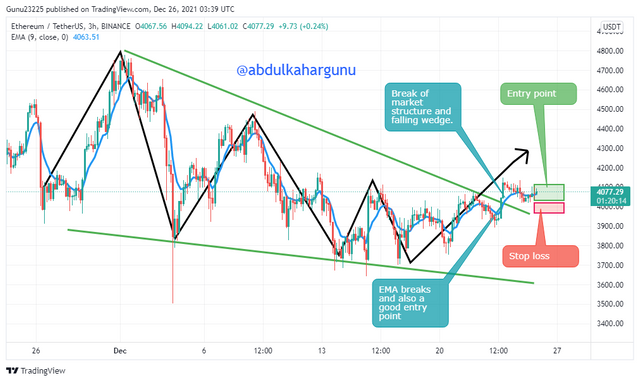 ETHUSDT Rising wedge chart: Source
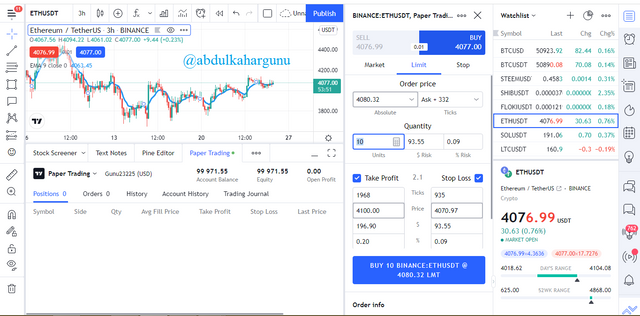 Trade setup
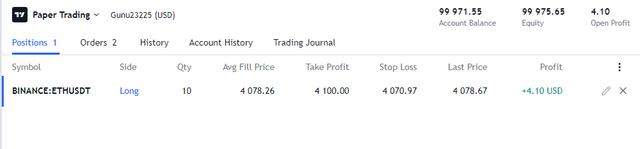 Trade proof
To be able to analyze and get a good sell signal, I decided to analyze the SHIBUSDT pair.
a) To identify the trend of the pair, I use the trendline method and incorporated the RSI indicator into it, I then added the EMA indicator to get a more in-depth look. I found out that the market was initially in an uptrend then suddenly broke from it and attempted a reversal.
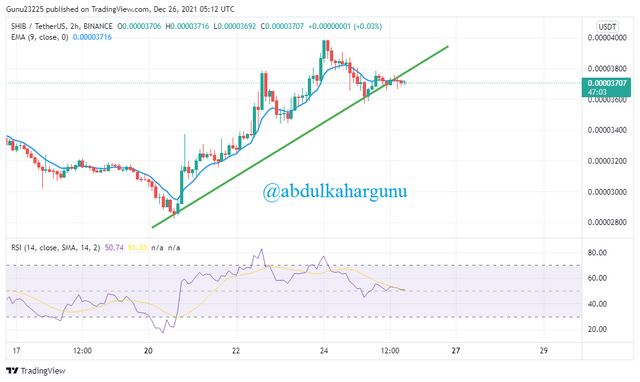 SHIBUSDT chart: Source
b) I employed the trendline approach to get the direction of the market, I then added the RSI indicator to check for the buying and selling regions. After the analysis, I saw that a reversal was to be expected since the RSI indicator showed an overbought signal.
I added the EMA indicator to find possible entry points and filter out false breakouts. I then find the breakout point right after the trendline was broken.
c) From the analysis gotten from the chart, we see how the RSI shows overbought however, the prices appear to be moving upward, this is called a diversion and means a reversal is to be expected. The EMA indicator gives up an ideal entry point because, after the break, it moves above the prices.
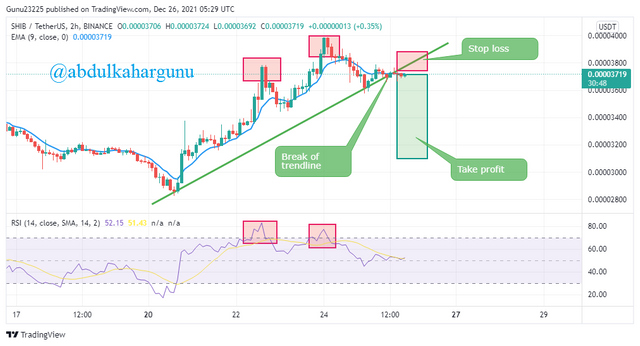 SHIBUSDT chart: Source
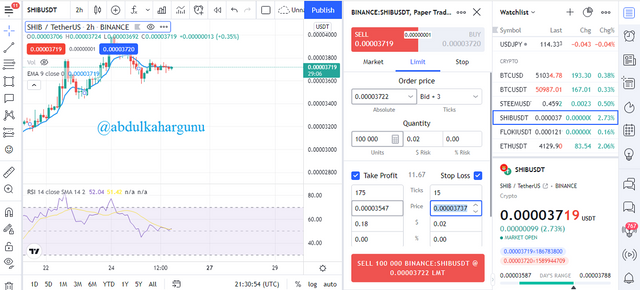 Trade setup
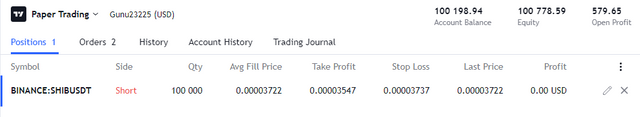 Trade proof
The introduction of cryptocurrencies have changed the financial system of the world completely, from making banking and easy and accessible to everyone and also giving the means to invest and earn either long or short period.
This has brought about the new professionalism called crypto trading, these people can read the market and predict the next big move which could earn them a lot of profits.
However, this is not without risks, since the crypto market is volatile, it calls for one to be vigilant and analyze the charts very well and use all resources to your disposal.
This calls for confluence trading, this means using different trading strategies to get accurate chart results before opting for trading.
Cc:-