dYdX (DYDX) at a Crossroads: Downtrend or Reversal Incoming?
Disclaimer: This is not financial advice. Please conduct your own research before making any trading decisions.
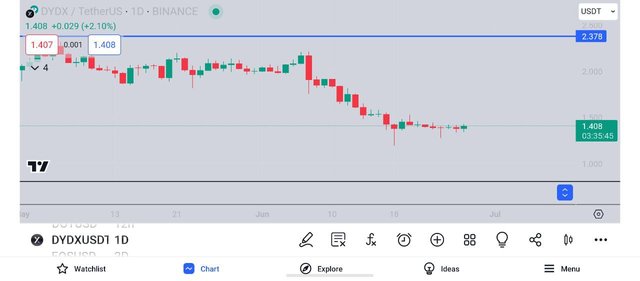
dYdX (DYDX) is struggling with a downtrend, currently priced at $1.40 with a 24-hour volume of $21.8 million. Investors are anxiously waiting for a potential price rebound, but the question remains: will it happen?
Market Context:
The DYDX chart hints at a possible price consolidation or even a reversal. There's a chance it might have found a bottom around $1.19. However, any conclusions need to be backed up by confirmation signals.
Downtrend Reversal or Continued Slide?
A clear break above $1.59 with a strong bullish candle would be a significant sign that the downtrend is reversing. This would suggest a potential shift in momentum.
On the other hand, if the price fails to break above $1.59 and continues trading below this level, the downtrend is likely to hold.
Trading Strategy (Wait and See Recommended):
Given the uncertain market conditions, a wait-and-see approach is recommended before entering any trades.
Consider a long position only if the price decisively breaks above $1.59 with a strong bullish candle, suggesting a possible trend reversal.
Keep a close eye on the price action around the current zone. If the price finds support and starts trading sideways, it could be an early indication of a reversal. However, a confirmed breakdown below $1.19 could signal a steeper decline.
Entry and Target (if reversal confirmed):
Entry: If a trend reversal is confirmed, a potential entry zone could be within the range of $1.30 - $1.38.
Profit Target: A potential exit point could be at $2.00, aiming to capture profits if the price breaks out and continues upwards.
Market Considerations:
Confirmation signals are essential before entering any trade. Wait for a clear break above $1.59 or a confirmed reversal from the current support zone.
The broader market sentiment can significantly impact DYDX's price.
Past performance is not necessarily indicative of future results. The downtrend could continue, or the potential reversal might not materialize.
Additional Considerations:
Briefly discuss any technical indicators that support the potential reversal zone around $1.19 or the resistance level at $1.59.
Emphasize the importance of confirmation signals, strict risk management with stop-loss orders, and the potential risks involved in trading during volatile market conditions.
Remind readers that this analysis is for informational purposes only, and they should conduct their own research before making any trading decisions.