Massive BTC Double Top | Will Bitcoin Avoid This Disaster?
Introduction
Welcome, friends! In this update, we will explore the recent developments in Bitcoin's price movements and technical patterns. Previously, we discussed Bitcoin's formation of a significant falling wedge pattern on the 7-day time frame chart and predicted a massive rally upon its breakout. Let's dive into the latest analysis and what it means for Bitcoin's future.
Bitcoin's Massive Rally and Technical Target
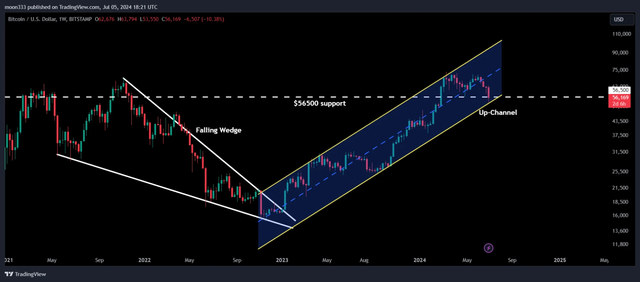
In previous articles and videos, I highlighted Bitcoin's potential for a substantial rally if it broke out of the falling wedge pattern. The technical target was set at approximately $70,000, and Bitcoin surpassed this target, However, Bitcoin is now breaking down the support at $56,500, the lowest price in May 2024, and forming a new uptrend channel.
Formation of a New Uptrend Channel
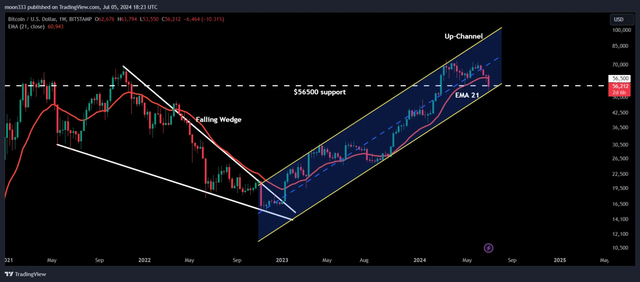
Bitcoin has established a new uptrend channel with defined resistance and support levels. Recently, Bitcoin has tested the support of this channel multiple times. Simultaneously, it has broken down the significant support of $56,500 and the EMA 21 on the 7-day time frame chart.
Descending Triangle Breakdown
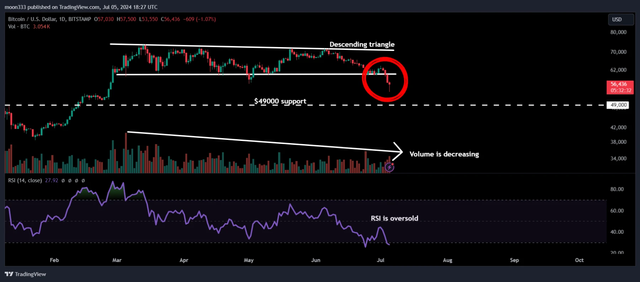
On the daily time frame chart, Bitcoin has broken down the support of a descending triangle. The volume has decreased significantly, and the RSI has entered the oversold zone. This could indicate a potential price reversal. The technical target for this breakdown is around $49,000, a significant support level previously acting as strong resistance.
Weekly Time Frame Analysis
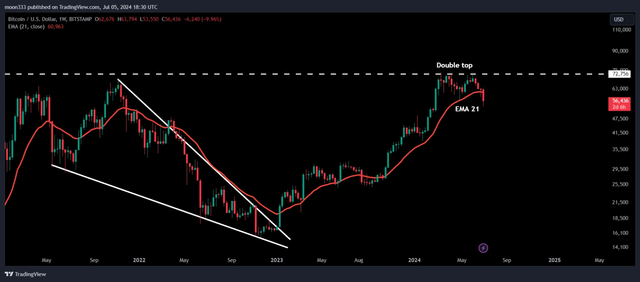
On the weekly time frame chart, Bitcoin previously formed a falling wedge pattern, predicting a massive rally upon breaking out. Bitcoin achieved a high of approximately $73,000. However, it formed a double top and is now moving downwards, breaking the EMA 21 support.
Bullish Divergence Signal
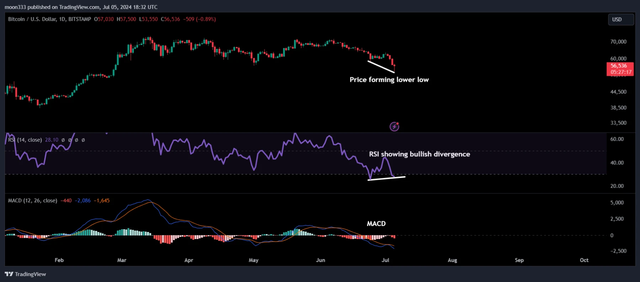
Despite the recent price decline, there is a bullish divergence signal. The RSI is forming a higher low, while the price is forming a lower low, indicating a potential bullish reversal. Additionally, a MACD crossover could further confirm a rally if it occurs soon.
Key Resistance Levels
For Bitcoin to resume its upward movement, it needs to break the resistance zone starting from $56,500 to approximately $59,750. If successful, Bitcoin could aim for the resistance at $72,756 and potentially try to break the $73,000 high.
Conclusion
In summary, Bitcoin's recent price movements have shown significant technical patterns and potential for both bullish and bearish outcomes. While the breakdowns indicate caution, the bullish divergence and possible MACD crossover provide hope for a rally. Keep an eye on key resistance levels and market signals for the next potential move.
Call to Action
If you found this analysis helpful, please like the article then follow the blog for more updates. For exclusive trading signals, consider supporting me as a YouTube or Patreon member. Links are as below:
https://www.youtube.com/c/moon333/join
https://www.patreon.com/moon333