Why This Weekly Closing Is Confirming The Bottom For Bitcoin (BTC) | This Will Be Another Historical Signal
Hi, friends hope you are well and welcome to the new update on Bitcoin.
In an hourly time frame, Bitcoin has formed an up channel and right now moving at the support of this pattern. At the same time, Bitcoin has also broken out the $19500 resistance level but was rejected by the next resistance of $20800.
imag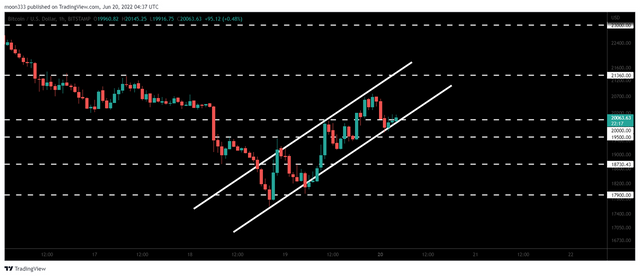
On the weekly time frame, a new candle stick has been opened and the opening price of the new candle is above the lowest price of the previous candle. If we watch the previous history of BTC, then after testing 200 simple moving average if the new weekly candle opens above the lowest price of the previous candlestick then Bitcoin finds its bottom there, now we need to wait for MACD to turn weak bearish, right now it is very strong bearish.