$GOLDSILVER: The anatomy of a FAILED Cup and Handle
Here is the current GOLDSILVER (gold-to-silver ratio) chart. Notice the Cup and Handle?

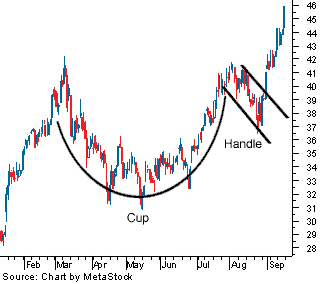
This is the anatomy of a text book Cup and Handle.
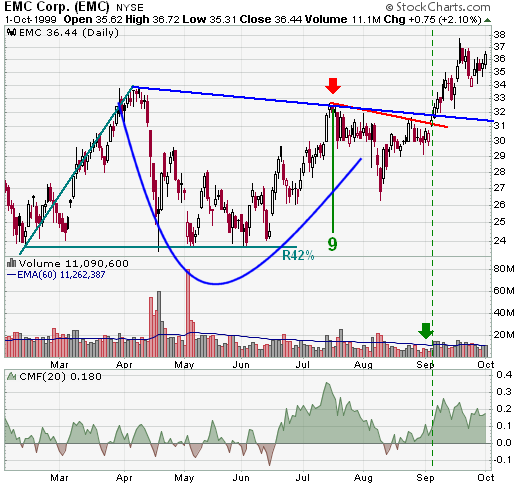
Let's analyze a Cup and Handle pattern with a similar lip slope as the current GOLDSILVER chart.

Notice that the current GOLDSILVER chart's (at the top of this article) right lip slopes slightly downward? So, is it possible, so far, it meets the requirements of a cup? Yes. Even the handle meets the 1/2-depth-of-cup requirement. Read here: (http://stockcharts.com/school/doku.php?id=chart_school:chart_analysis:chart_patterns:cup_with_handle_continuation)
So, you should be asking yourself, "Why does the author call this a "FAILED Cup and Handle"? Notice the PEAK of the handle? While it certainly and momentarily pierced resistance, in order to remain bullish, the price action MUST remain ABOVE former resistance in order to become SUPPORT and prove bullish. Could the GSR (gold-to-silver ratio) challenge resistance again? Yes. Just remember, that resistance occurred on 3 separate occasions, otherwise known as a "triple top".
I remain very BULLISH metals. So, in order for metals to RISE, the GOLDSILVER ratio (the first chart at the top) MUST fall. Remember these rules when using the GOLDSILVER (gold-to-silver ratio):
1. When GOLDSILVER rises, metals fall. 2. When GOLDSILVER falls, metals rise. 3. When GOLDSILVER falls, SILVER's return on investment (ROI) is 2x as much as gold's ROI (by percentage).
The Maestro!
Great Post!