The $2,625 Barrier: Will Gold’s Bull Run Shatter Resistance?

Gold has captured the attention of investors worldwide as it edges closer to a critical resistance level: $2,625. This level, a confluence of long-term trendlines and Fibonacci extensions, could be the key to determining whether Gold’s bull run continues or stalls. With its recent surge breaking past key technical thresholds, traders and investors are asking one pressing question: Will Gold’s momentum shatter this barrier? Let’s break down the technical signals driving this rally and what they reveal about Gold’s next move.
The Importance of $2,625: A Critical Resistance Zone
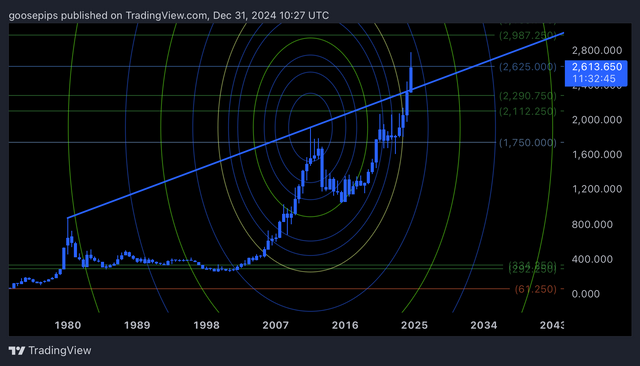
At $2,625, Gold faces a major hurdle. This level corresponds to the 1.618 Fibonacci extension, a critical zone where many rallies historically pause or reverse. It’s also situated near the intersection of the outer arcs of Fibonacci Circles, a tool that maps potential turning points by combining price and time dynamics.
This makes $2,625 more than just a price target—it’s a psychological and technical battleground. A clean breakout above this level could pave the way for Gold to aim for the next Fibonacci extension at $2,987, signaling a continuation of the bull run. Conversely, rejection here could trigger a retracement to lower levels.
The Bullish Case: A Historic Breakout
Gold’s recent rally has been fueled by its break above a decades-long trendline, highlighted using a Ray tool on the chart. This trendline has historically acted as a ceiling for price growth, containing Gold’s movements within a defined range. The recent breakout suggests a significant shift in momentum, supported by strong fundamentals such as inflation concerns and geopolitical uncertainty.
This breakout aligns perfectly with Gold’s interaction with Fibonacci Circles. Historically, prices tend to rally as they pass through key arcs, which act as dynamic support and resistance levels. If Gold sustains its upward momentum, the next major target beyond $2,625 is $2,987, a level that aligns with the outer Fibonacci Circle arc.
The Bearish Case: What Happens If $2,625 Holds?
Resistance zones like $2,625 aren’t just arbitrary—they often represent points where buyers face increased selling pressure. If Gold fails to break this barrier, it could trigger a retracement. Key support levels to watch include $2,290 and $1,750, both of which align with lower Fibonacci retracement levels and inner arcs of the Fibonacci Circles.
A rejection at $2,625 would not necessarily signal the end of Gold’s rally but could indicate a temporary consolidation phase before another attempt to break higher.
Key Technical Tools in Play
1. Fibonacci Circles:
These dynamic arcs provide insight into where price could react, combining time and price analysis. Gold’s current position near the outer arcs suggests a critical juncture for its trend.
2. Fibonacci Retracement Levels:
Horizontal levels like $2,625 (1.618 extension) and $1,750 (0.618 retracement) offer key support and resistance zones to watch.
3. Ray Trendline:
The long-term trendline breakout highlights a shift in Gold’s trajectory, providing strong bullish confirmation.
What to Watch Next
• Bullish Continuation: A sustained move above $2,625 could open the path toward $2,987, signaling a new trading range for Gold.
• Bearish Rejection: Failure to break this level may result in a pullback to $2,290 or lower, offering potential entry points for long-term investors.
• Market Catalysts: Inflation, central bank policies, and geopolitical tensions will remain critical drivers of Gold’s movement in the months ahead.
Conclusion: The $2,625 Decision Point
Gold is at a pivotal moment. Its ability to break above the $2,625 barrier could define the course of its bull run, setting the stage for a move toward $2,987. With Fibonacci Circles, retracement levels, and long-term trendlines converging, this level represents more than just a price—it’s a defining moment for the market.
Whether you’re a trader looking to capitalize on short-term momentum or a long-term investor seeking clarity, keep your eyes on $2,625. The next few months could be crucial in determining whether Gold’s bull run continues to shine—or takes a pause.