Gold On The Cusp Of $200+ Rally
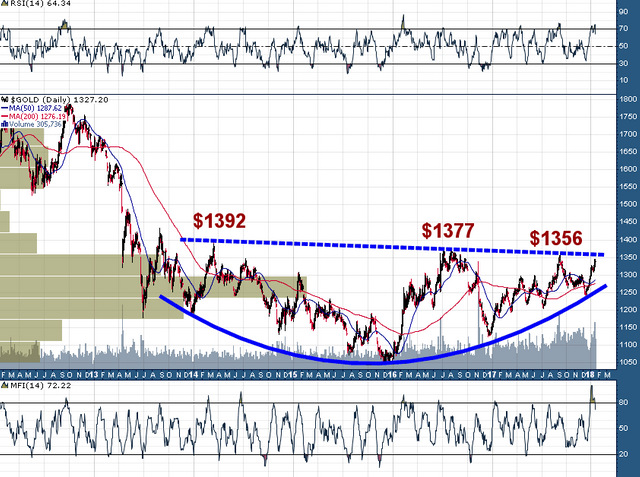
It seems like we've been here before, but make no mistake, this moment is unique and potentially crucial for the long term path of the gold price. Since crashing down from the mid $1500s in April 2013 gold has spent the last five years carving out a massive long term bottom. It is this broad based bottom which has the yellow metal on the cusp of greatness once again:
Gold (Daily - 6 Years)

Since rallying from $1045 in December 2015 to $1377 in July 2016 gold has been trading within a narrowing range amidst a series of lower highs and higher lows. A resolution seems close at hand, and the bullish scenario would see a snapping of the streak of lower highs (above $1360), followed by a breakout into the $1400s; which would leave gold in a volume-by-price vacuum which extends all the way up to the open gap from April 2013 at $1560.50.
The bearish scenario would see a drift lower back to test major support and the rising 200-day moving average near $1275-$1280. Such a scenario may inevitably lead to the upward breakout over $1400, however, it will simply take more time and require more volatility (shaking out of weak hands).
From my vantage point I can't recall seeing gold in such a bullish spot technically while sentiment was still relatively muted. The strongest bull moves don't give buyers many chances to buy on dips so we should know which scenario gold will be following fairly soon.