Here is why WTI Crude Oil is likely to head lower in to next week
WTI Crude Oil is likely to head lower in to next week and here is why
WTI Crude has had a fantastic run higher (if you are a bull!) for 2 years. The strong recovery from $26.05 initially topped at $55.24 at the beginning of 2017 & sold off to $42.05. A powerful rally followed, taking prices to a high of $66.66 in just 7 months, a gain of 58%. The total gain over the 2 year recovery was 155%
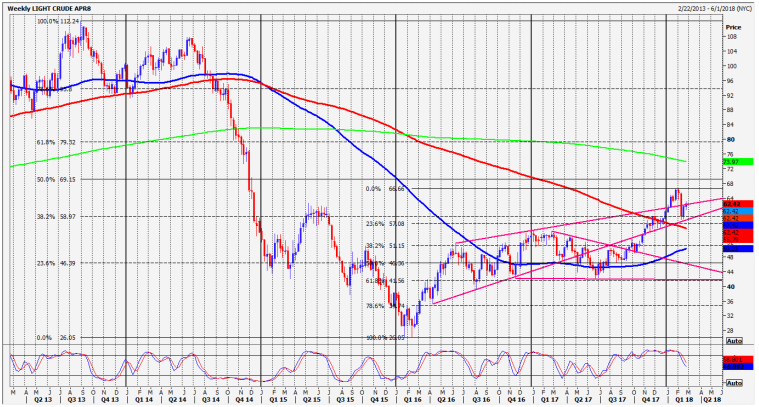
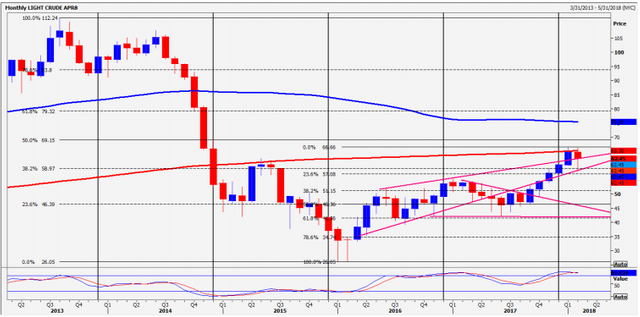
The weekly chart above shows how the recovery halted just below the 50% recovery area of $69.15. However we have to go to the monthly chart below for a clearer reason for the potential end of the recovery. See how the red 200 month moving average at $65.00/$65.30 worked almost perfectly as resistance. This was when we warned our subscribers to exit all longs. We did not manage a monthly close above $65.30.
Looking at the shorter term 4 hour chart below we see another reason why the recovery came to a halt. The red 200 period moving average worked as resistance, just below the 61.8% Fibonacci resistance at $63.38.
There must be some bulls caught in a trap who used this as their opportunity to escape. A great opportunity too for bears to regain control.
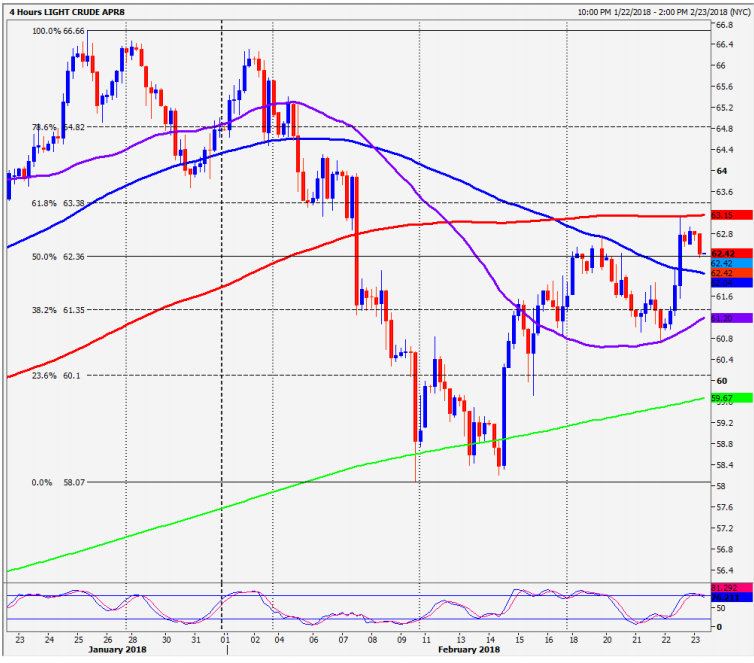
So we see a strong indication that the price will head lower from here, signalling a short term bear trend starting to build now. We have to assume this is only a correction to the 2 year bull trend at this stage. We are likely to head towards the first support at $61.35/60.85. Failure here obviously keeps bears in control initially targeting $60.10. Below $59.70 keeps the pressure on for a test of the February low & 100 day moving average at $58.20/58.07. The reaction here will help us decide if this is still a correction, or a more serious bear trend is developing.
A break below the 38.2% Fibonacci at $57.26 signals a move towards the December low & 200 week moving average at $55.82/55.60.
Nice, following. Take a look at my forex blog and consider following me back.