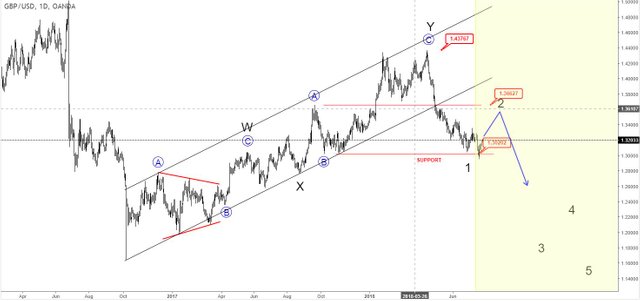
Forex Analysis Report 7-26-18...GBP/USD...Trade Set-Up To Go Long Is Under 1.3000

The GBP/USD currency pair is rising as Theresa May pushes forward her Brexit plans in an attempts to secure a final Brexit agreement with the EU by the provisional October deadline. The US dollar is also helping the appreciation in the currency pair as its hitting some weekly supply.

Lets go straight to the weekly chart for the GBP/USD pair.
Monthly Chart - the monthly trend was broken back in May, signal an major shift in price. Monthly demand is at 1.2100 and monthly supply is at 1.4800.

Weekly Chart (Trend Timeframe) – the trend is clearly down and price recently hit the top of the weekly demand zone.

Daily Chart (Entry) – there is daily demand at 1.2925 which sits within weekly demand and daily supply at 1.3470. The chart suggest to buy long when price comes back down into the daily / weekly zone because there are buyers as indicated by price just touching the upper zone and pulling away quickly.

This post is my personal opinion. I’m not a financial advisor, this isn't financial advise. Do your own research before making investment decisions.

Published on

by rollandthomas

Great analysis. I think more or less the same.

Great minds think alike:)
Interesting thanks for sharing!!
You are quite welcome @pjcswart
Thanks you're awesome!
Well done!
I keep my short positions anyway, even if a correction is around the corner.
Good luck :)
Yes, there is money to be made shorting as well, the trend is still down. I'm looking for a reversal near the 1.3000 level.
Yes, there is money
To be made shorting as well,
The trend is still down.
- rollandthomas
I'm a bot. I detect haiku.