TRADING S&P 07/11/2017 Daily insight, S&P futures, ES
This is my daily preparation for S&P futures (ES) trading and it is for your educational purpose only and definitely cannot be considered as financial advice. There is a substantial risk in derivative trading and it might not be suitable for you. Don't rely on past performance as it is not indicative of future results.
Market remain balanced, which together with the performance of the last 3 weeks leaves the same core levels that were observed during last week are in charge. These are 2447.5 as major resistance and 2402.25 as major support. Both these levels are expected to be major targets as well during this week.
Yesterday, we observed a break upwards outside of Friday's range, but due to the lack of any longer term player, market sold back after fake break out of 2429.75 level by 1 tick. Yesterday most trading evolved at 2428 prices after market approached 2429.25 and after few tick retracement and became balanced. This revealed unwillingness of longer term players to join the market. During the closing hour, we could observe a fake break out at NQ (Nasdaq) futures at very low volumes which also stimulated some buying activities at ES, which was used by daytraders to exit long positions before end of the day. All this caused an active sell out at market close.
Today we have JOLTs number, which might attract some new participants. Nevertheless I expect the market to remain rather balanced, with some bearish attitude, as a result of yesterday's market closing activities. Considering the fact that we are likely to open inside yesterday's and Friday's ranges, I primarily expect the market to reach 2416 high volume support area. In case we won't observe active selling during opening, than we are likely take a direction towards Friday's and yesterday's points of control, which are 2423 and 2428 high volume areas.
In case these levels will be broken the following target towards downside is 2402.25 with some possible resistance between 2409-2412. The next target price towards upside would be 2436.5, with most resistance area between 2432-2434. This high volume area between 2432-2436 was built during June and expected to be the major magnet and resistance area at the same time towards upside.
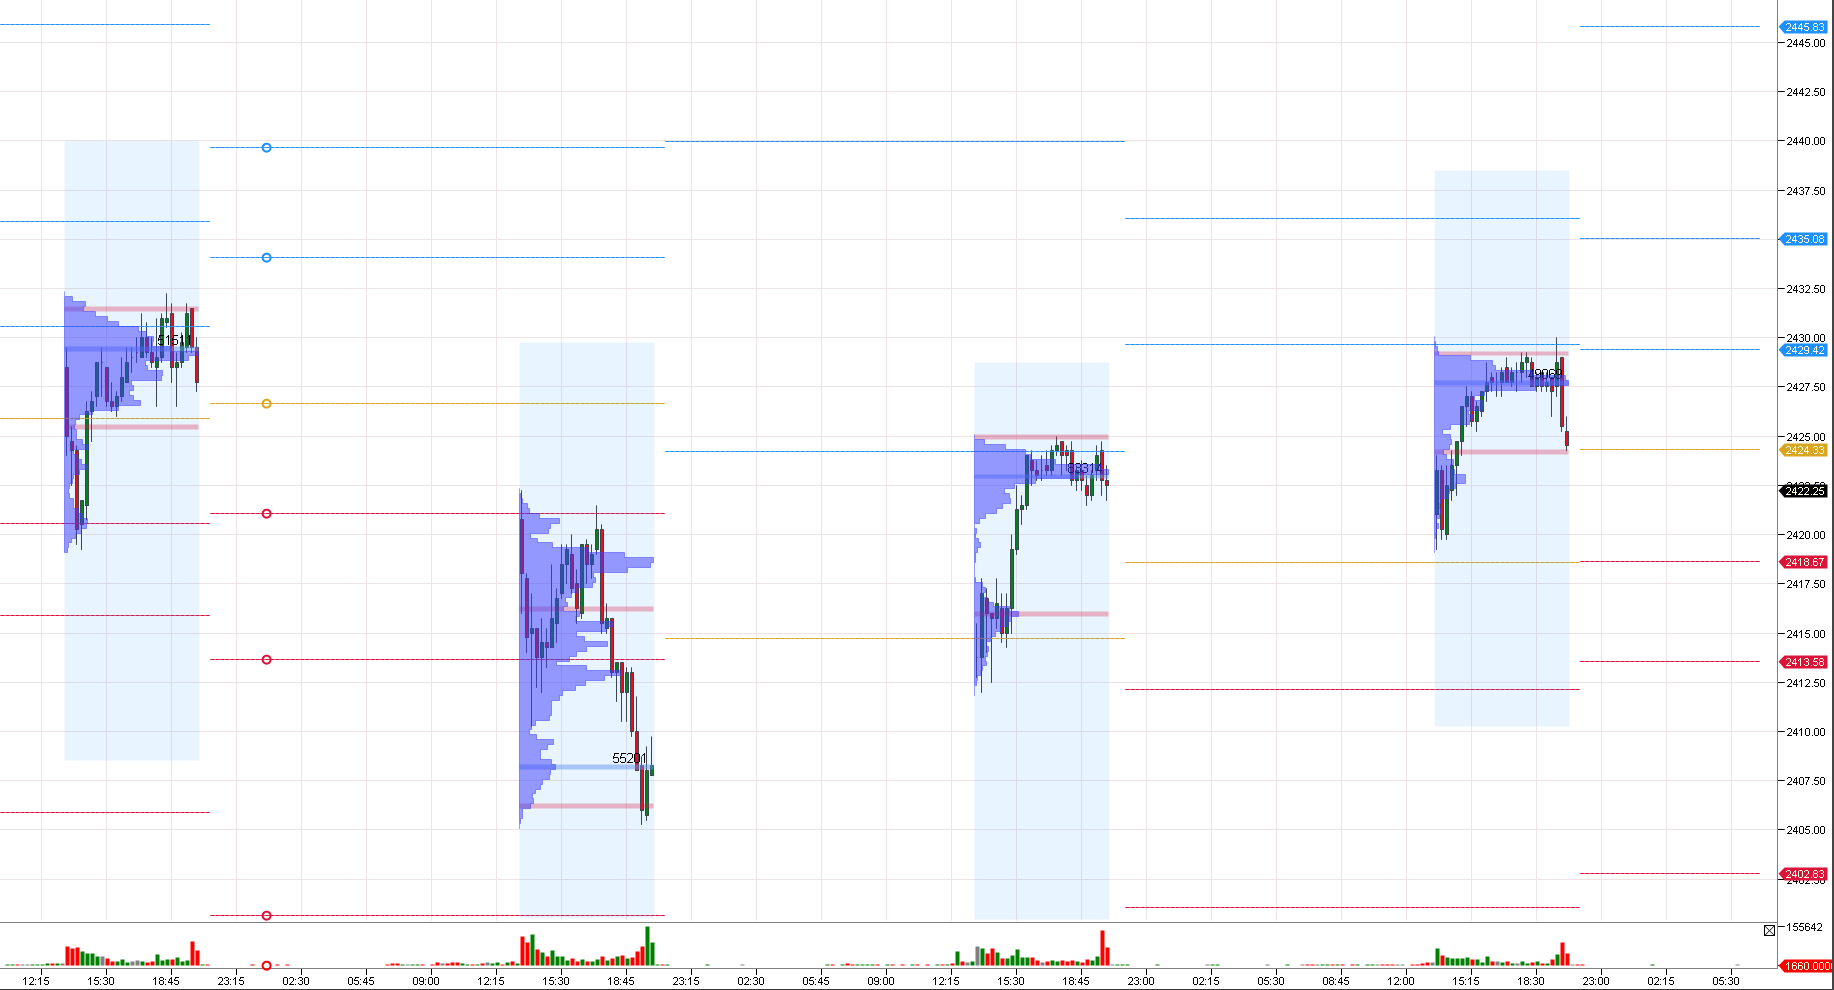
This chart represents daily ranges with volume profiles for Wednesday (07.05), Thursday (07.06), Friday (07.07) and Monday (07.10)
I'm long on this one :) I see daily "flag" , go back to support price and looking to go back to last highs :) will see right?
If I understood properly, you are on daily charts. Than yes, you are right, trend is definitely upwards and it is too early to be bearish. I daytrade, so these insights are for shorter term trades and I'm not expecting a significant move. If it will get outside levels I mentioned I won't be trading today.
Based on open interest and volumes, we had some liquidation on Thursday, congestion on friday. Yesterday we had minor accumulation, but the way it played at the close I don't see that market accumulated enough to break up from this flag.
the all time high was also formed during opening and mainly was a result of liquidation of short position during Monday 06.19 opening and the gap from friday and did not look like new players were jumping in for long at those prices. Similar situation also formed 2447.5 high, also during opening with the gap liquidation of shorts during opening with significant sell out. This caused formation of this flag, which is largely a retrace to June's major volume or balance area and now we are below it. You can see it on this chart with volume profile:
But the way bottoms are being bought, definitely doesn't provide much confidence for short from longer term perspective.