Ethereum Price Technical Analysis
Ethereum price after a correction against the US Dollar started to move higher once again, and currently looking to break a major resistance area.
Ethereum Price Technical Analysis
Key Highlights
Ethereum price after correcting lower towards the $10.85 level against the US Dollar found support.
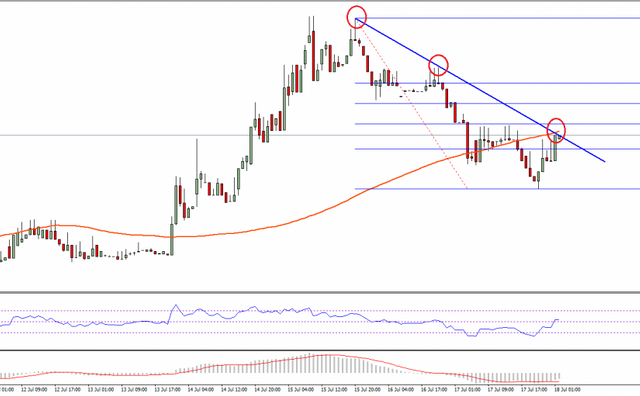
There is a bearish trend line formed on the hourly chart (data feed via Kraken) of ETH/USD, which may provide us the next move in the near term.
If the ETH bulls succeed in breaking the trend line resistance, then more gains are possible.
Ethereum Price Buy with Break?
Ethereum price ETH struggled during the end of this past week against the US Dollar and traded towards the $10.85 level. The price started to move higher once again, but currently facing a major hurdle for more gains. There is a bearish trend line formed on the hourly chart (data feed via Kraken) of ETH/USD, which is currently acting as a resistance and stopping any further upsides.
The most important point is the fact that the trend line resistance is also near the 100 hourly simple moving average, suggesting the significance of the highlighted barrier. Moreover, the 38.2% Fib retracement level of the last drop from the $12.20 high to $10.85 low is also around the same area.
Ethereum Price Technical Analysis
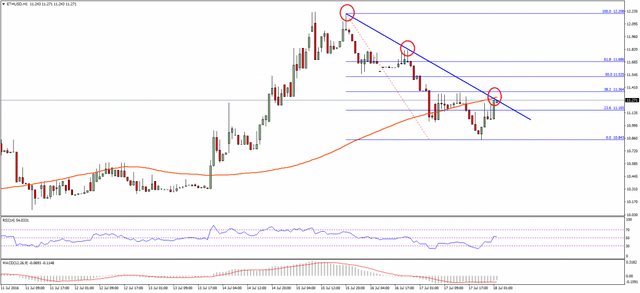
In short, there is a major resistance formed near $11.30, which is likely to act as a pivot area. If the ETH bulls manage to break it, then there is a chance of more gains in the near term. The next resistance in that situation would be around the 61.8% Fib retracement level of the last drop from the $12.20 high to $10.85 low at $11.68.
Hourly MACD – The MACD is in the bearish zone, but may move into the bullish slope soon.
Hourly RSI – The RSI is now above the 50 level levels, which is a positive sign for the bulls.
Major Support Level – $11.10
Major Resistance Level – $11.30