Is Ethereum Ready to Play Catch Up With Bitcoin?
In mid-June of this year, the difference between the market capitalization of bitcoin and Ethereum had narrowed down to less than $8 billion. This had many market participants excited. They expected Ethereum to dethrone bitcoin as the leader, a move popularly termed as flippening.
Key observations
- Ethereum has hugely underperformed bitcoin
- The chart pattern suggests that Ethereum is likely to play catch up in the next few months
- Stay on the long side of Ethereum to benefit from the bullish setup
However, fast forward five months and the difference in the market capitalization of the top two cryptocurrencies has increased to about $96 billion. This shows that while bitcoin has raced ahead in the past few months, Ethereum has hugely lagged behind.
However, is the underperformance about to end?
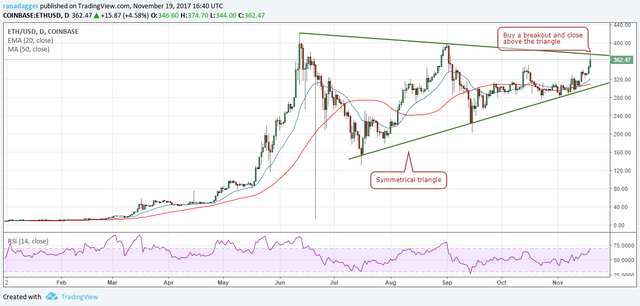
The chart pattern shows that Ethereum is likely to embark on a rally of its own that can carry it to $645 to $670 levels in the next few months. Let’s see how we arrived at these levels.
Ethereum opened trading at $8.16 on January 1, 2017. It started its rally in March and by June 12, it reached a high of $420, an astronomical rally of about 5047%. Thereafter, it entered a period of consolidation, digesting the gains.
On the charts, Ethereum has formed a large symmetrical triangle, which usually acts as a continuation pattern. The breakout is generally in the direction of the long-term trend, or the trend that was prevailing before the pattern formed. In this case, the sharp move from January to June confirms that the cryptocurrency was in an uptrend before forming the triangle.
However, this is not a fool proof trade because sometimes the symmetrical triangle acts as a reversal pattern. Therefore, the best way to play this trade is to wait for a breakout of the triangle before initiating any trade.
Where can we take an entry?
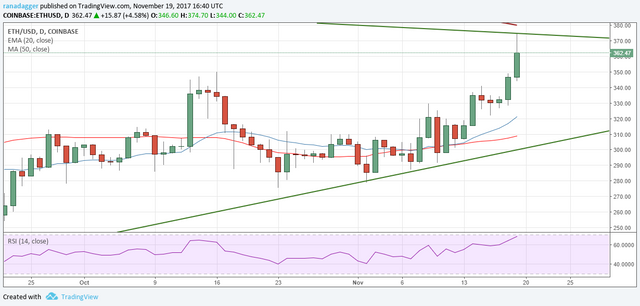
Currently, the resistance line of the triangle is at about $378 levels, a level close to today’s intraday highs. The bears are likely to strongly defend this level. However, if the bulls breakout of $378 and manage to close above the resistance line, the trade on the long side will set up.
Different traders use different methods to confirm whether the breakout is valid or not. Some wait until price moves 3% above the breakout level, others wait for three consecutive closes above the resistance level.
However, we have observed that the best breakouts never look back, hence, waiting for three days may lead to a missed opportunity. Therefore, we can wait for a closing above the resistance line of the triangle and initiate the long positions on the following day.
The breakout can face resistance at $400 and $420. However, we expect the virtual currency to scale both these resistances and rally towards its pattern target zone of $645 to $670.
Notwithstanding, even the most reliable patterns can fail. Therefore, our stop loss will be kept at $340. We don’t want to hang on to the trade if it falls back into the triangle. We shall raise our stops to breakeven as soon as Ethereum breaks out to new lifetime highs. From thereon, we shall trail the stops higher to protect our paper profits.
Note
The chart pattern suggests a resumption of the long-term uptrend in Ethereum. However, this will not get confirmed until the cryptocurrency breaks out and sustains above $380. Therefore, please initiate positions only on a breakout and close above the triangle. Entering presumptive trades may result in losses.
Don't forget to follow us on our twitter. Search for us on twitter. @CryptzSignals

