ETHUSD - Technical Analysis October 21, 2017 - Current Price $295
ETHUSD - Technical Analysis October 21, 2017 - Current Price $295
As Bitcoin heads into the fork, it has reached all time highs, breaking above $6000 yesterday. Unsurprisingly alt coins are taking a bit of a beating and likely in part because individuals are selling off to acquire BTC for the hard fork.
This is what is known as a lemmings trade. We saw the same thing going into the August 1 fork where bitcoin cash was created. We should be looking for similar setups as post fork the major Alt coins all got a price bump in both USD and BTC pairings.
We are stalking Ethereum for an entry. The fork is estimated to occur on October 25th, some exchanges are suggesting sooner, October 23 - traders and investors need to be on their toes.
Daily
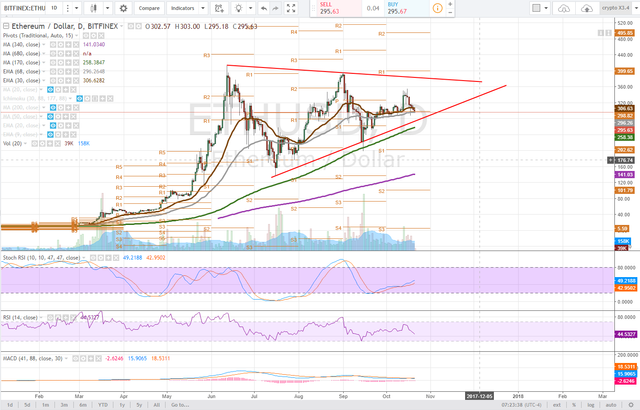
On the daily time frame we have been tracking this pennant formation and while there are a few ways to draw it especially on the different exchanges, It looks like we are going to hit the lower trendline. Currently, the price has found support at the 68ema and this needs to hold.
If thee 68ema fails to hold (grey line) we would be looking for a test of the lower trendline, which if it breaks, we find support at the 170dma (green line) just below.
The Stochastic RSI has been maintaining its slight uptrend as the price continues to consolidate. A bearish MACD cross occurred and the RSI has been trending down. Bullish momentum is waning as ETHUSD plays out the chart formation.

4 hour
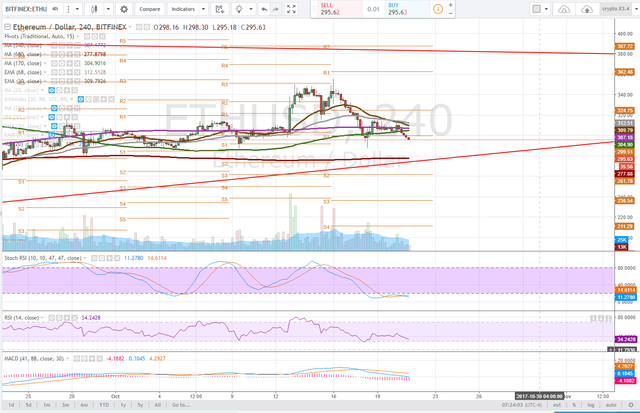
The 4 hour time frame is a lot more concerning for bulls as the moving averages have continued their convergence in a bearish manner and the price has fallen below them, failing to negate the double top formation we pointed out in our last analysis of ETHUSD.
The Stochastic RSI is in a downtrend and the RSI continues to slide lower. Looking at the MACD it is hanging around deviation zero and with any signs of life we will look for bulls to come in and by this dip over the next few days, specifically post fork.
Just above trendline support, we are observing a trendless 680dma which will act as support though it is going to converge at the TL.

1 hour
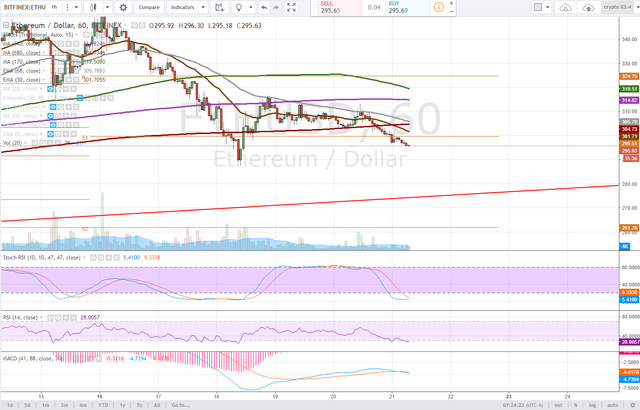
Th 1 hour time frame is showing us a similar story to the 4 hour with a series of bearish moving average crosses. I would note the price range for fluctuations in ETHUSD have tightened over the last few hours though it is still in a downtrend.
The 30 ema has crossed below the 680dma and the 68ema is not far behind. ETHUSD also lost pivot support on this time frame and will have to work hard to reclaim it.
The Stochastic RSI has reached downtrend on this time frame with the MACD showing a bearish cross and sitting well below deviation zero. The RSI is hugging oversold ranges and while more downside action should be expected, it will become increasingly difficult for bears and short sellers will need to take profits ahead of the fork - to get their bitcoin gold.

Long term holders should be looking for an opportunity to add if price support holds at the trendline as well as traders should be looking to position for a scalping opportunity after the fork if/when individuals sell off their bitcoin.
Bullish Above: $314
Bearish Below: $287, very bearish if trendline and 170dma fail to hold - approximately $276
RISK TRADE: R/R is not here yet to take a position given the event we know is incoming. Once could begin scaling into a long position, but the prudent should wait for either a test and bounce of trendline or a break back above the $300s which would drive the moving averages back into a bullish setup.
Don't forget to use stop losses!!
ollow at your own risk, Not a financial adviser, understand the risks associated with trading and investing. Manage your own Risk - in other words you could lose it all and it's your own fault.