Ethereum Price Technical Analysis – ETH/USD Faces Tough Resistance June 27, 2017
Ethereum price has started a recovery against the US Dollar and Bitcoin, but the ETH/USD pair is likely to face offers above $270 and $280.

Key Highlights
- ETH price traded further lower and almost tested the $200 support against the US Dollar.
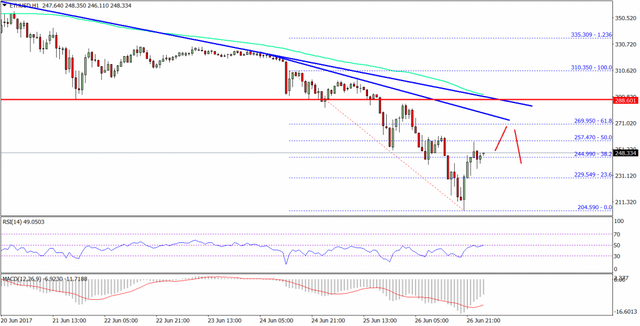
- Yesterday’s highlighted two bearish trend lines with resistance at $275-288 on the hourly chart of ETH/USD (data feed via SimpleFX) are still valid.
- The price is currently recovering, but likely to face sellers near $270 and $288 in the near term.
Ethereum price has started a recovery against the US Dollar and Bitcoin, but the ETH/USD pair is likely to
face offers above $270 and $280.
Ethereum Price Trend Lines Resistance
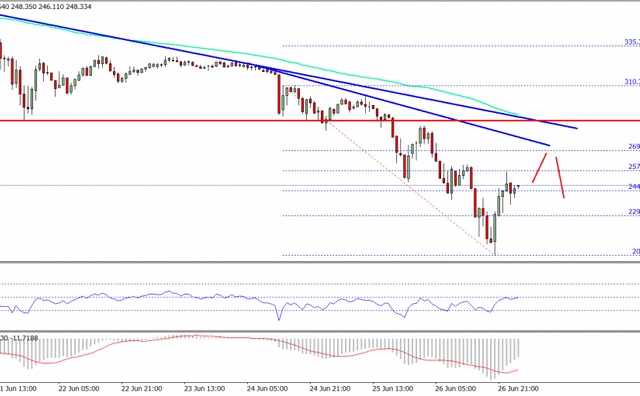
There were further losses in ETH price below the $240 support against the US Dollar. The price failed to overcome selling pressure and traded close to the $200 level. A new weekly low was formed at $204 from where a recovery wave was initiated. There was a strong buying interest above $200, which opened the doors for a recovery in the near term. The price moved higher and traded above the 23.6% Fib retracement level of the last decline from the $310 high to $204 low.The current wave trend is positive, but there are many hurdles on the way up near $270 and $288. Yesterday’s highlighted two bearish trend lines with resistance at $275-288 on the hourly chart of ETH/USD are waiting to stop the upside. Moreover, the 50% Fib retracement level of the last decline from the $310 high to $204 low is at $257. The 100 hourly simple moving average is also waiting above the trend lines at $290 to act as a barrier.

So, if the price continues to move higher, it is likely to face resistances starting from $260 up to $288. On the downside, the $200 handle is a monster support zone.
Hourly MACD – The MACD is reducing the bearish zone.
Hourly RSI – The RSI is about to move above the 50 level.
Major Support Level – $220
Major Resistance Level – $288