ETHEREUM.. Back Against The Ceiling.. Sept 25, 2017
Analysis:
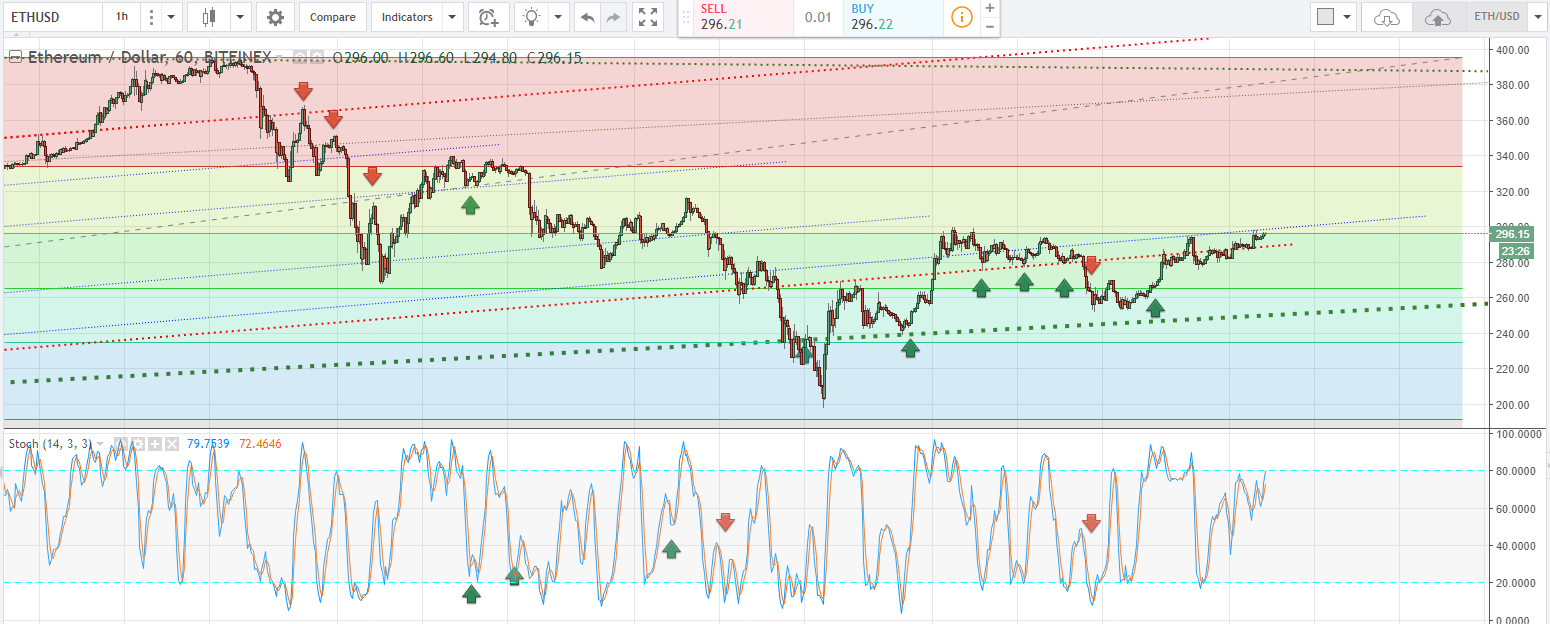
4th time is usually the charm, and this will be the 4th test of the $300 level since the 18th of Sept. Signals are also OB, which has a risk of accelerating to the upside.
Foot Note:
-RIGHT CLICK ON IMAGE AND OPEN IN ANOTHER TAB TO SEE FULL RESOLUTION-
When analyzing this chart, you will notice the Slow Stochastics indicator. I find this indicator to be the complete indicator compared to the vast majority out there. Lets explore the terms I will be using. Also use the indicator based on its respective time-frame:
Time-Frame:
1 hour - Lasts 1 hour - Few days
Daily - Last Days - Week(s)
Weekly - Last Week(s) to Month(s)
Term used:
OB - OverBought (above 80)
OS - OverSold (Below 20)
Bullish - Above 50
Bearish - Below 50
Trend - Cross up in both channel line or Cross down in both channel line.
Follow me if this has been helpful, and don't forget to give me an upvote if you feel that this article has helped in some way.


Thanks for info mate ! i upvote and follow hope you follow me back Cheers :)