price analysis
ETH/USD
we expected the support zone between the trendline and $940 to hold on jan 17 ethereum broke below the trendline and fell to a low of $770
the bulls bought the dip aggresslevly which has resulted in a pullback that carried the cryptocurrency towards the 50 percent fibonacci retracement levels of the recent fall $1424 to $770
for the past three days the ETH/USD pair has been struggling to cross above $1097 if the price break out of the $1100 levels we expect a move to $1174.36 and $1248.28 levels as the stop loss is $930 which doesn't offer a good risk to reward ratio we are not suggesting any trade on it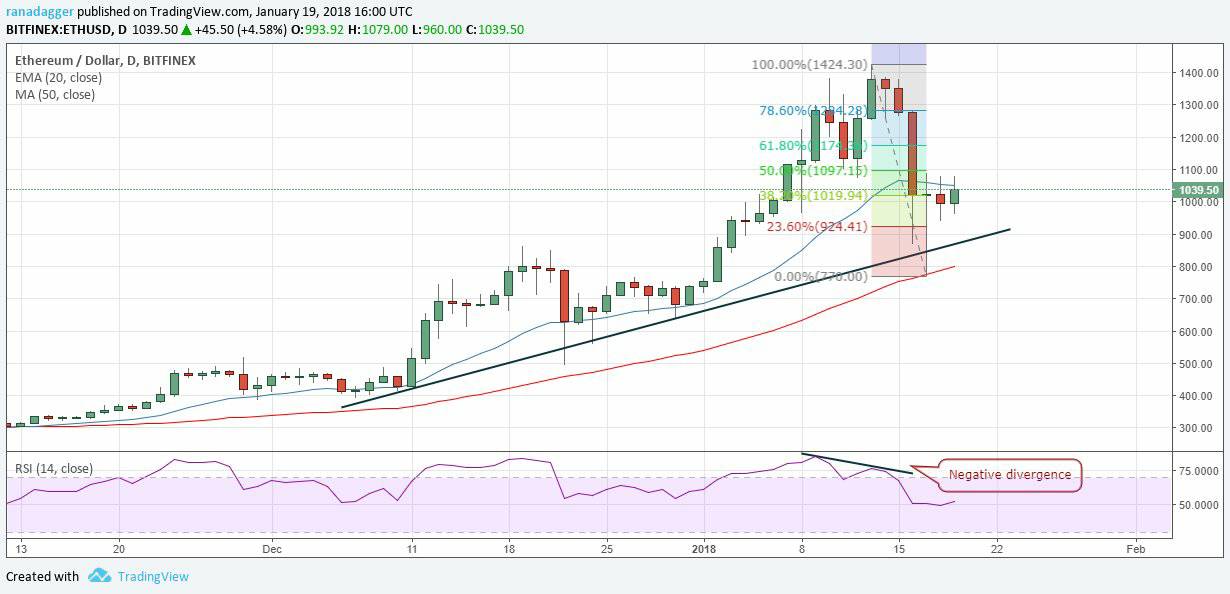
ethereum is down back soon
Agree! Here is my support to that scenario:
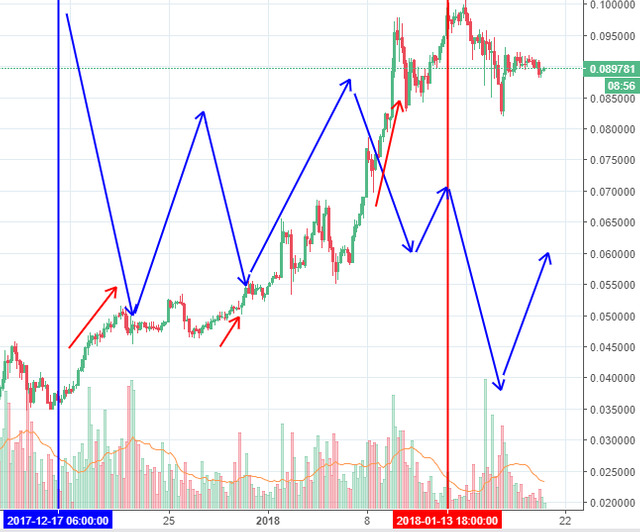
Both ETHUSD and ETHBTC has just starter the correction, but BTCUSD is in downtrend for over 20 days.
I would even be more bearish not on ETHUSD, but on ETHBTC.
I am looking for correclation between ETH and BTC. My small analysis is behind the chart:
good analysis
Lot of people hanging out on the sidelines but are ready to jump back in I say it will continue ups and downs but gradually hit new highs then people will keep taking profits and wait again for a pullback.
Good graphs
Good job