ETHUSD

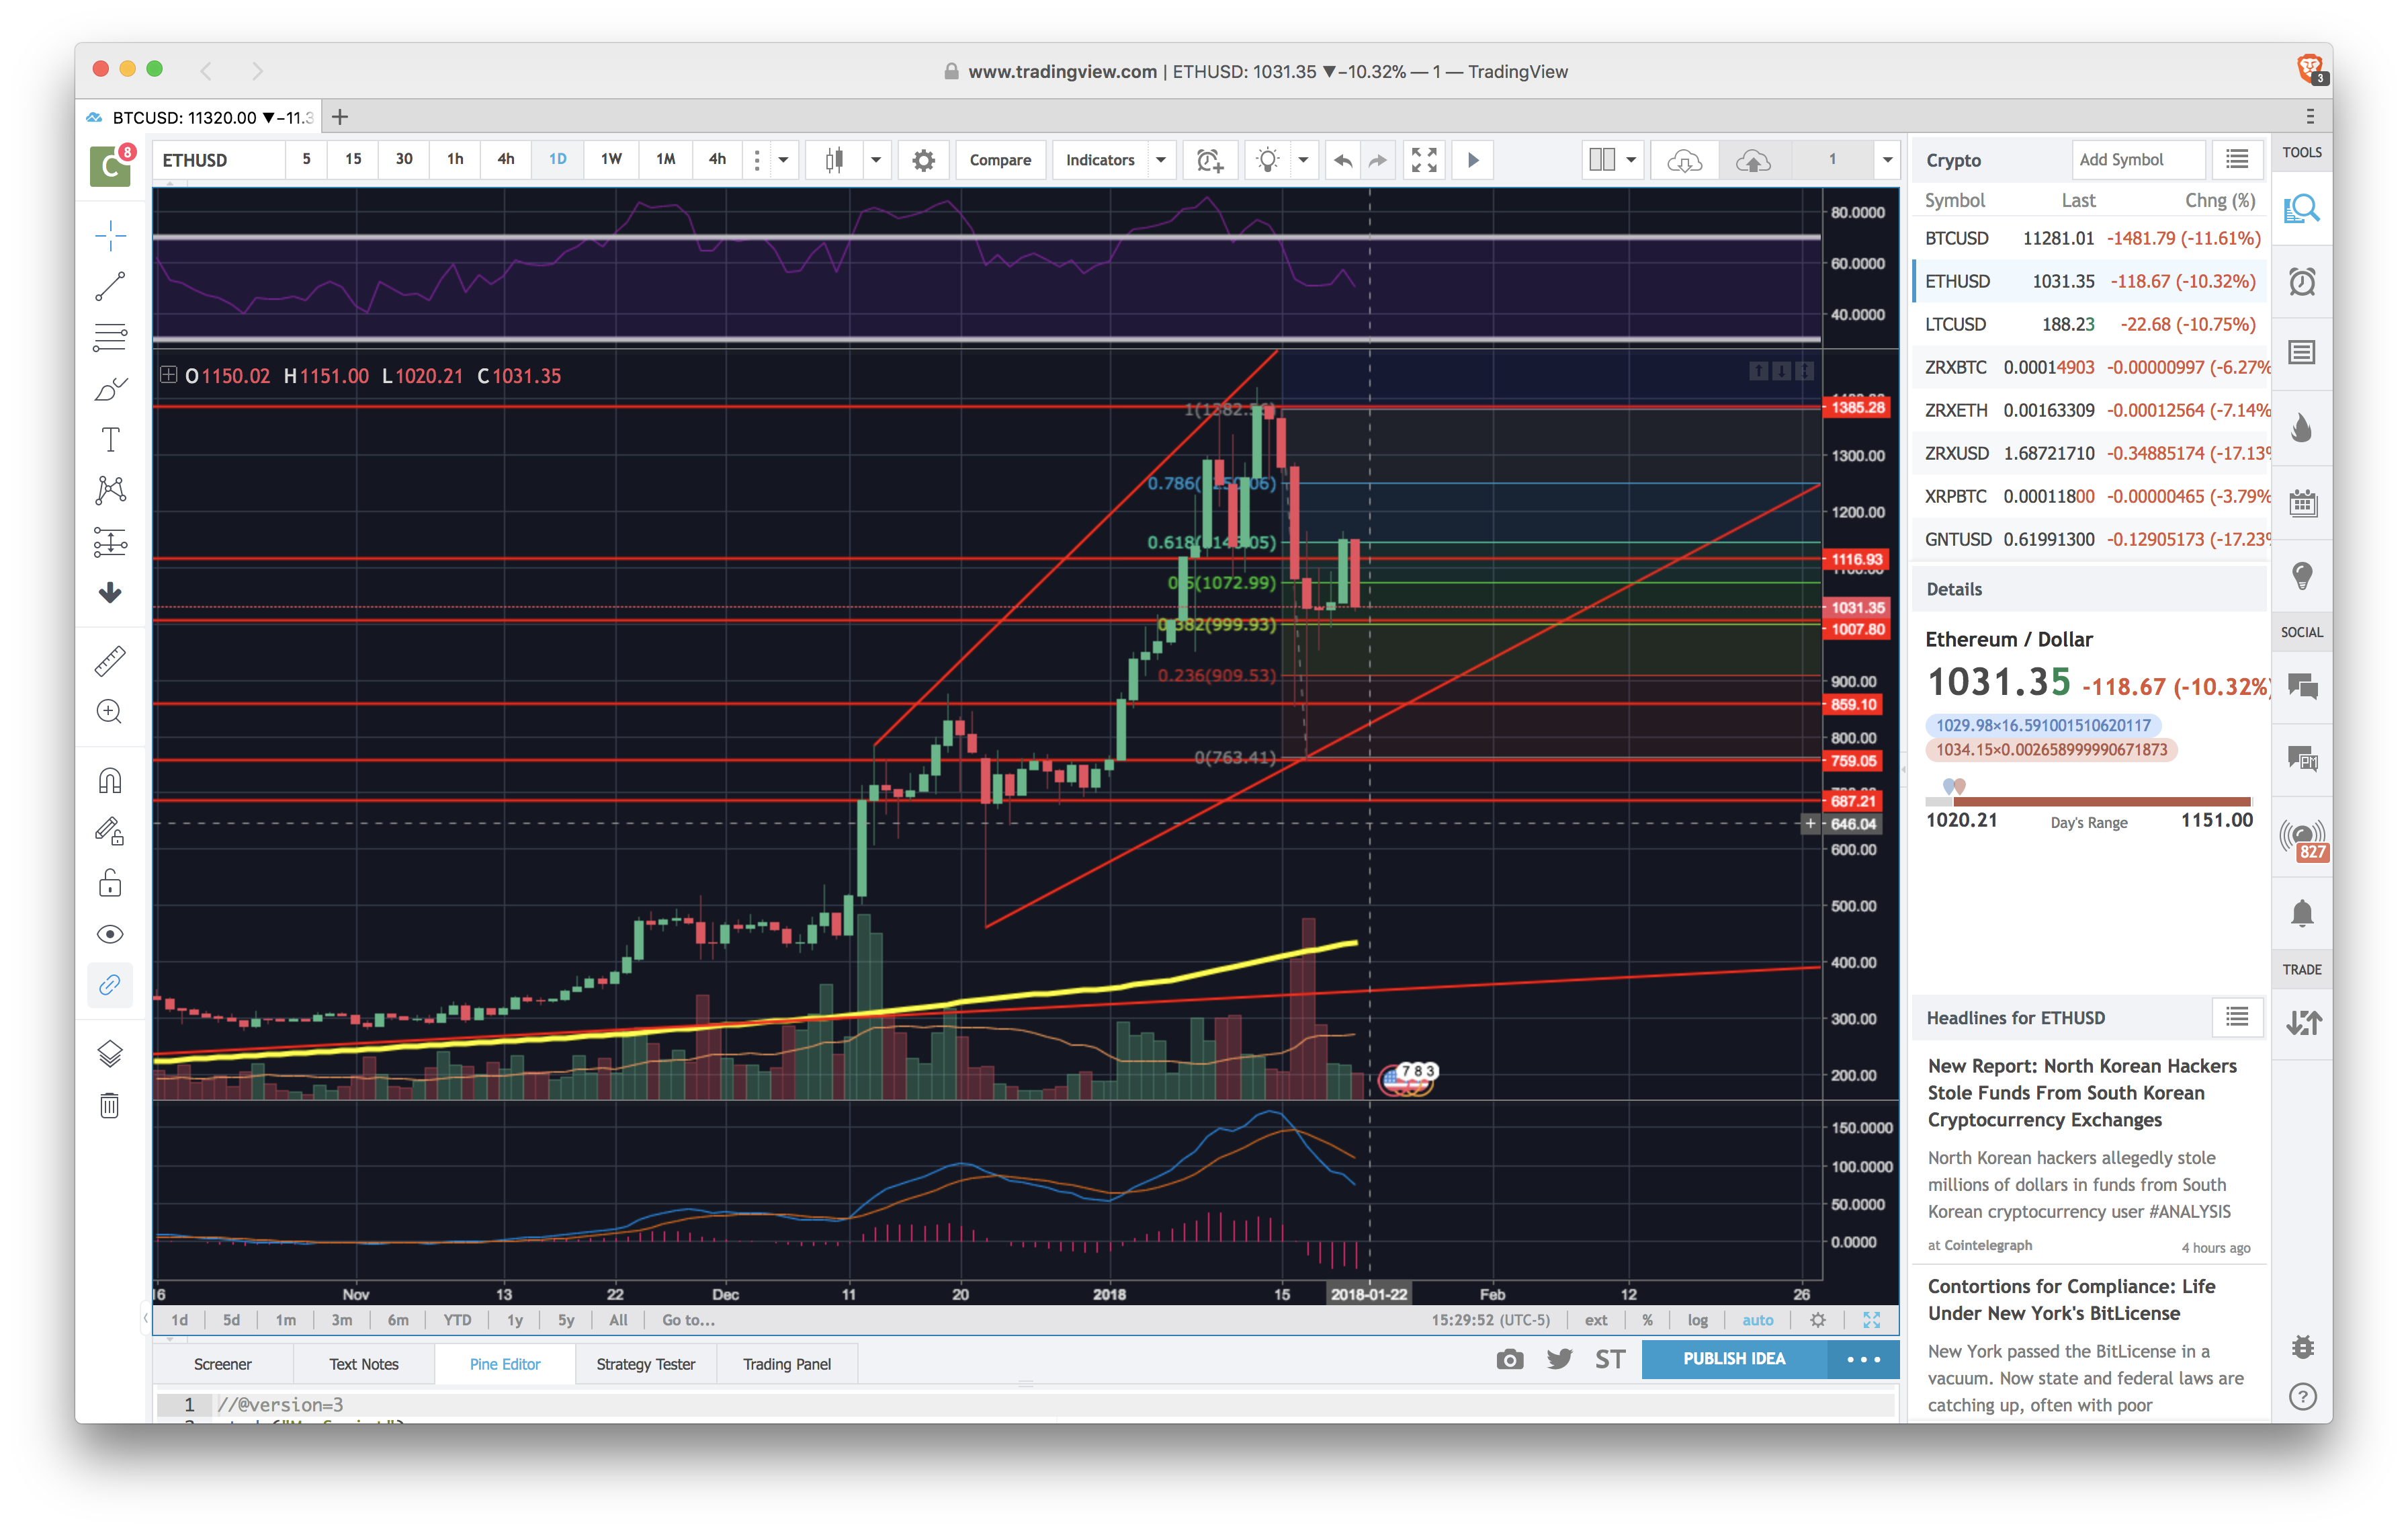
Ethereum is headed back down to the 1007 support line as of this post. The next stop is 859~. Ethereum is still following a daily uptrend, RSI is currently headed down, and MACD and signal lines have just crossed on the 15th of January. The histogram is following price movement and it seems like the price will come down tonight to tap the uptrend lower channel line. Based off the volume given in this chart, Ethereum has been losing volume, and even selling volume has been low since the big price move on the 17th. Ethereum should find support at 859, and maybe a quick tap down to 759, and back up and resume the uptrend.
Disclaimer: This is my, Lee's Investment, own analysis of the CryptoCurrency chart(s). These are not to be taken as Certified Financial Advisor positions. Take these trades at your own risk. Lee's Investment, is not a certified advisory firm, and is only providing information for educational purposes. You are required to perform your own due diligence to take these trades. You should always check with your licensed financial advisor and tax advisor to determine the suitability of any investment.