Ethereum(ETH) Chart Trading Study in 14th July.
Hi~^^
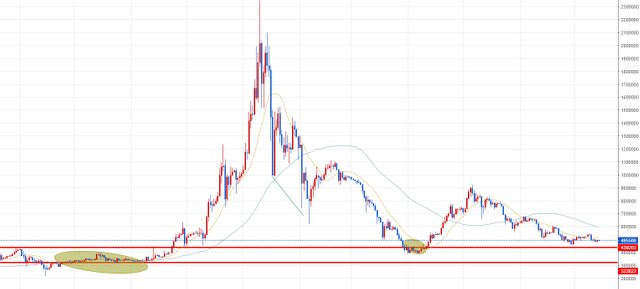
- 1day candle chart
I'll look at the chart from the day candle.
I would like to approach the med-term viewpoint.
It has risen to the right by breaking the last 15-day lines.
This is the rebound point of the previous peak.
It approach the support point of $439 as the first purchase.
And, It approach 322$ as second purchase.
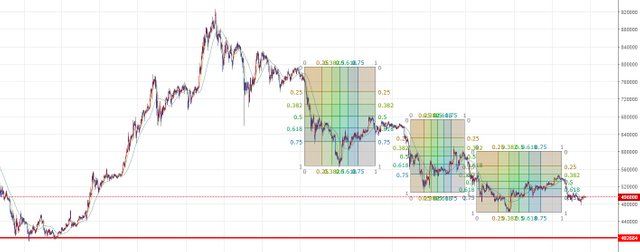
- 1hour candle chart
It should approach it from a swing trading viewpoint.
Look at the chart. It regularly rises from the previous peak to the center of the box.
Again, approaching at $402 after it deviate the support point.
** Disclaimer: This post is a personal idea, not an investment idea. The transaction is a small transaction, so please enjoy it. It is your responsibility to invest, and you should be aware of subjective judgments and technical analysis to make investments.