Ethereum Update(14/06/2017): Correction In the Horizon?????
Today I want to start this analysis with a QUESTION, Is this a right time to enter this script?
Oh don't look up at a heading now , I am not going to be bias in any view......
Ethereum is a Digital Currency which has gain its popularity in very short span of time and you must have heard in news or read on other Authors article that how its market cap is about to surpass that of Bitcoin. I am not going to discuss here its fundamental detail as I am very week in that, but everytime I write such article, I just try to read out charts as per their command.
Now if i draw your attention on chart below its just a plain chart few stick which we called candle and by looking at those candle you can also get little bit of idea about the behavior of particular script, which I don't think its enough for decision to invest or trade.

So, in order to get a bigger perspective of the behavior of particular script and in this case its ETHEREUM, we analyst use our drawing tools and chart start to look like way it is looking now below.
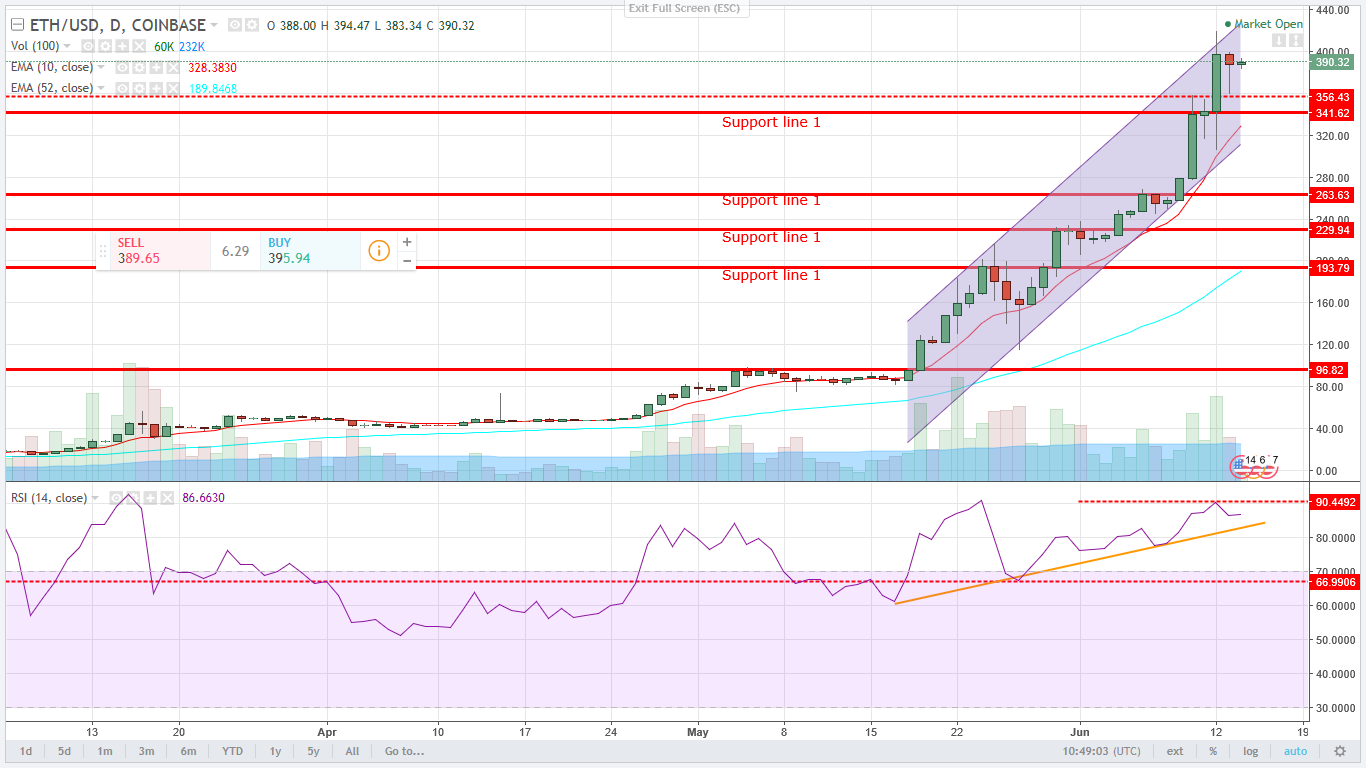
Now I come quickly on a point, you can notice in chart above that Ethereum is in a bull run and in a one month only it has move from $96 to $420 which is roughly around 430% gain. It is following a nice higher high and high lows pattern which is also visible in RISING CHANNEL(highlighted blue lines). If Ethereum continues to follow this channel then day before yesterday it touches a all time high of $420 which is at top point of rising channel, now it is moving sideways or consolidating around these levels but their is higher probability of touching of lower end of this RISING CHANNEL which come roughly at $308.
Now the scarier picture.......
Chart below is weekly which means one candle tells a movement of one week in it. If I draw your attention on this chart, I want you to notice its surge, it just spike up like a rocket and also negating its moving average and in process it also in Extreme over bought zone.
Just to quickly wrap up this up please look at where 10 week EMA is laying and how far this script has move far from it. It is a certainty in chart that every script try to test its ground which we call support in technical term. And i am afraid this moving average is at $201 now, which this script can test in short span of time.
So , I conclude this analysis with an answer to question I raise at start that this is not a right time to enter this script, its too much much heated up and can correct significantly any time and then check fundamental news related to it fall afterwards. 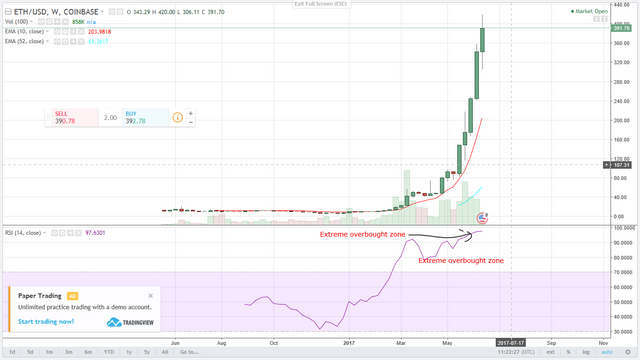
If you like my analysis do upvote, follow, comment @jimmyrai28
if not then criticize, this also will be highly appreciated.
You can also drop a comment in 'reply' if want you want me analyze any script of your choice.
Great job ! Upped and resteemed ! 👍👍👍
I have to tell you, I wish I had bought some a couple months ago... In seeing the chart going up as fast as it appears to be doing, I'd be a little afraid at this point that if my go down, but what do I know... It may go up for another two or three months... If only I could see into the Future...
@pocketechange
A picture in weekly chart is very scary!!! At least it is for me.
I noticed a large jump in upvotes when I clicked to upvote... It was almost like I had given you 30 or more votes... I hope that was the case...
Yep, you are my lucky hand.
Una correzione è possibile, si tratta di vedere se è un semplice ritracciamento o una discesa molto più significativa.
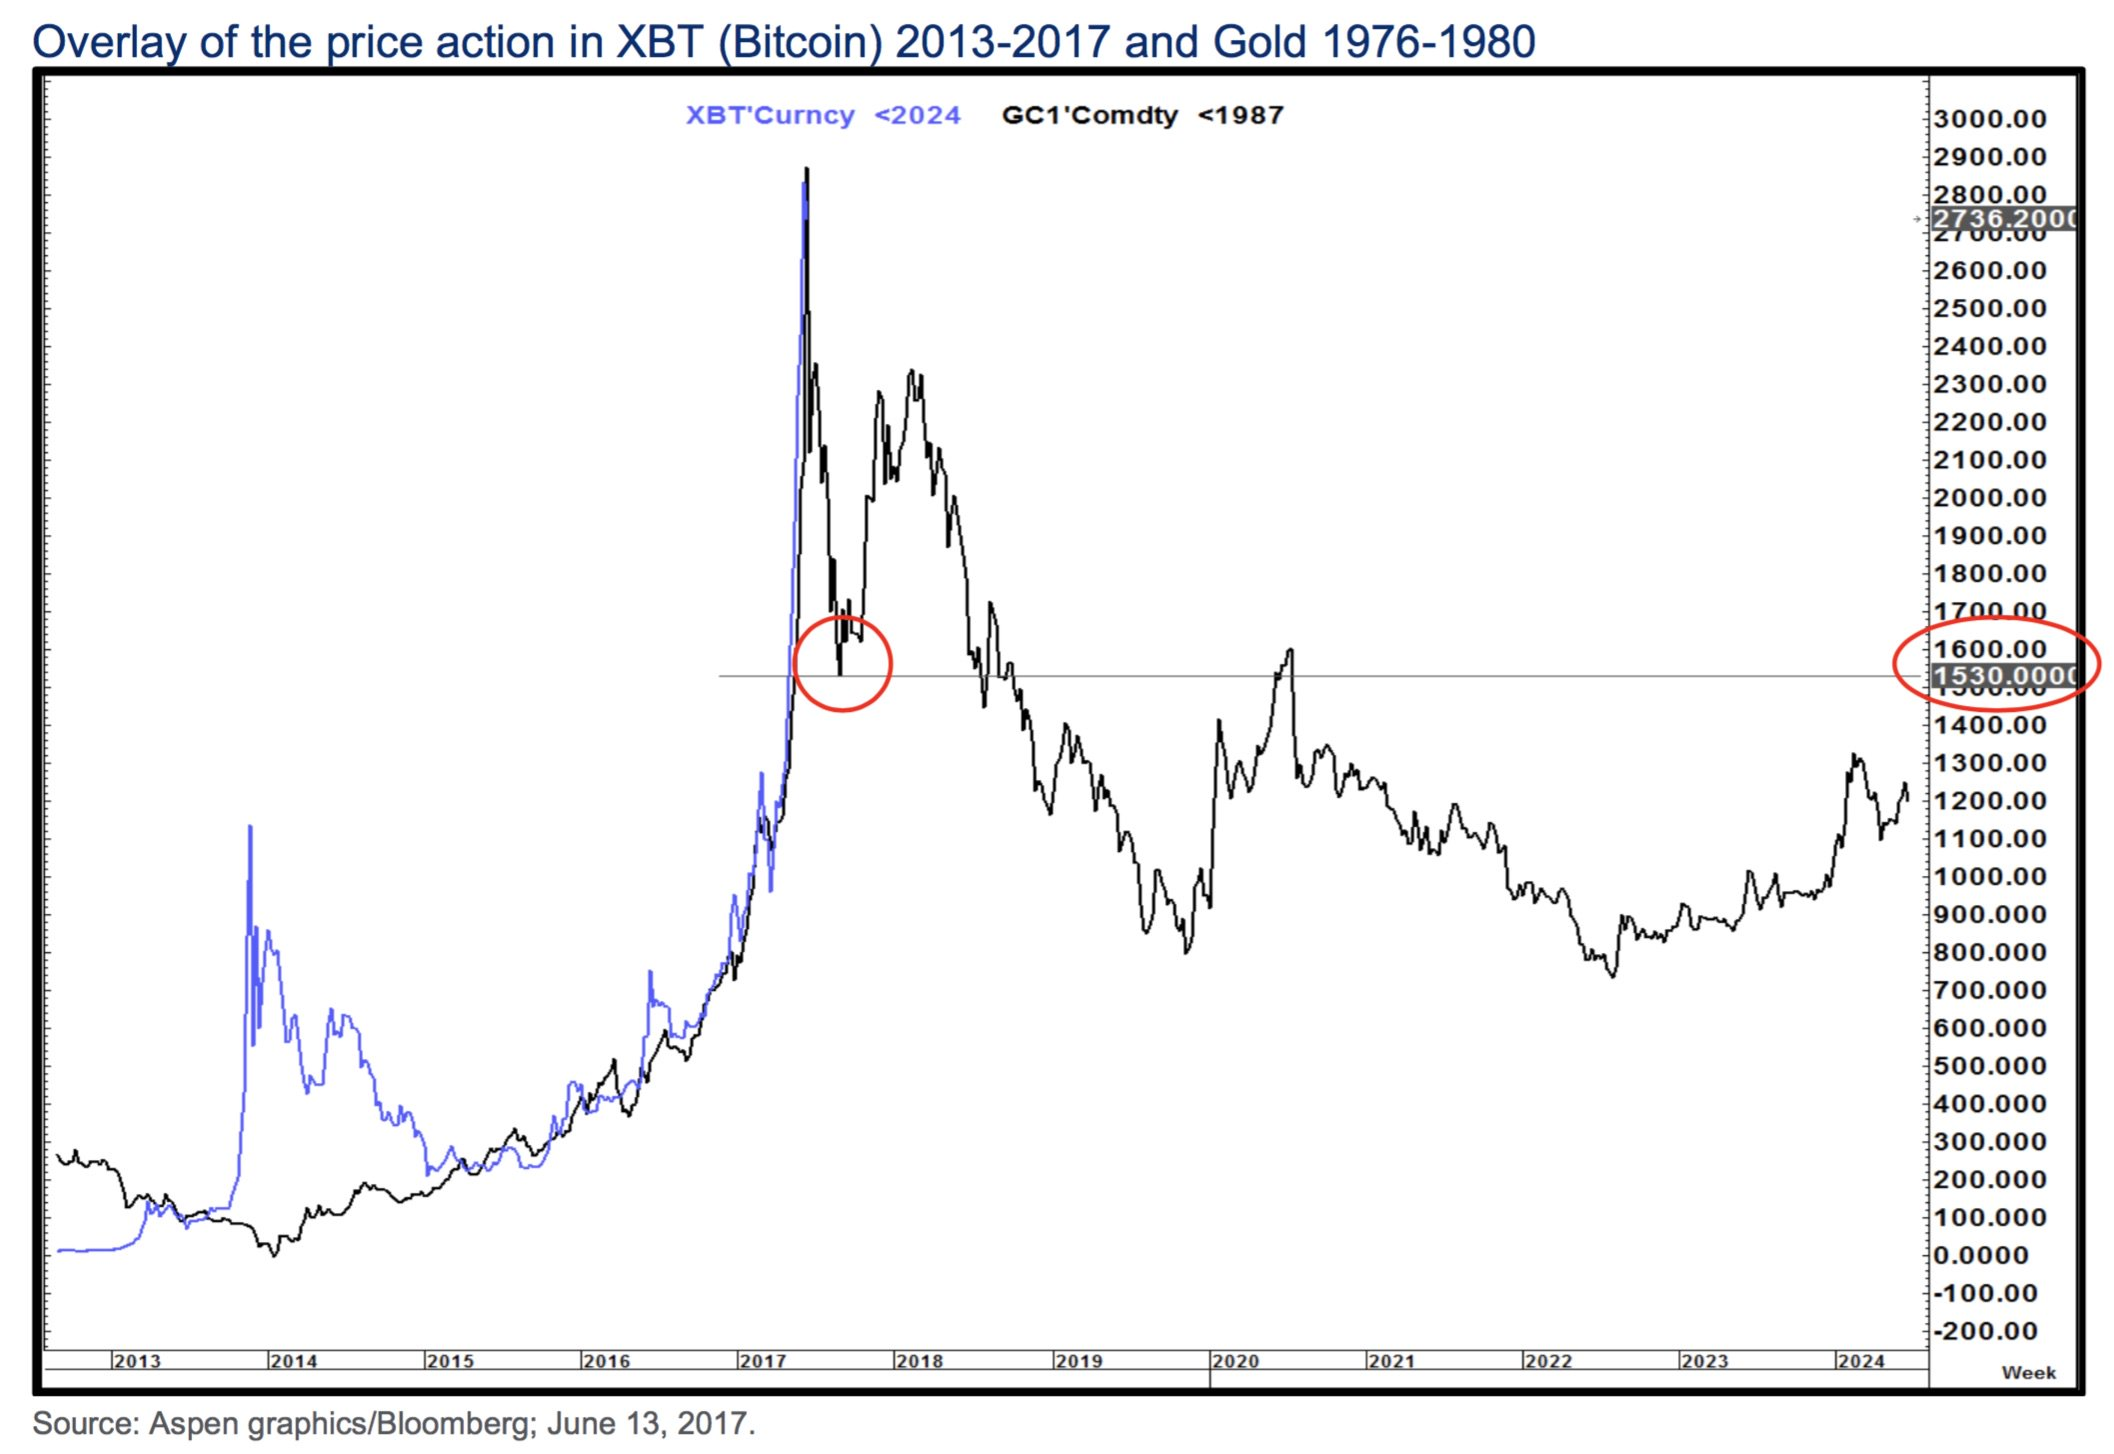
Su un sito ho visto che hanno paragonato la salita di bitcoin all'oro negli anni 1976-80
non so se ethereum si assimilabile, ma tutto ciò che sale troppo in fretta poi rischia di scendere anche velocemente.
Buddy can't understand your language sorry, plz type in english so that i can understand
Translation, courtesy of my limited Italian + Google Translate:
A correction is possible, this is to see if it is a simple retracement or much more meaningful.
On a site I saw that compared the ascent of bitcoins and 1976-80 gold over the years.
I don't know if it is similar, but all that ethereum ascending too quickly could then fall fast.
yep u r spot on!!!
Interesting post! Thanks for share ^_^
Thanks too for stopping by!!!
A massive dump is going to take place. I'll buy another 100 ETH if price goes under $300
upped ^^
RSI is at all time high and is really overheated that too in weekly charts.
Yes eth at around 200 level is good investment and can be accumulated .
Thanks for stopping by and understanding my analysis.
Actually I have no fear until it goes under $8. Becoz 90% ETH I purchased at this level ......... I'm not a regular trader now, but, always keep eyes on the market movements as I'm a bagholder :)
Yep, its always gud to keep track of your investments.
And i must appreciate your holding power, many don't have , i included!!!
Yeah the RSI is cooked, i wouldnt touch a stock that overbought..actually i would short the shit out of it haha
haha,
yeah spank this monkey!!!
Thanks for the ETH update!
You are welcome mate!!! and Thanks for your footprint on my blog!!!
In this enviroment price action (candles) are the only thing you can use. RSI MACD and that stuff aren't made for these mania environments. See the mega hammer on ETHUSD 1D: https://www.tradingview.com/chart/ETHUSD/MudufCws-LONG-ETHUSD-Long-1D-Mega-Hammer/
:)