Ethereum Analysis
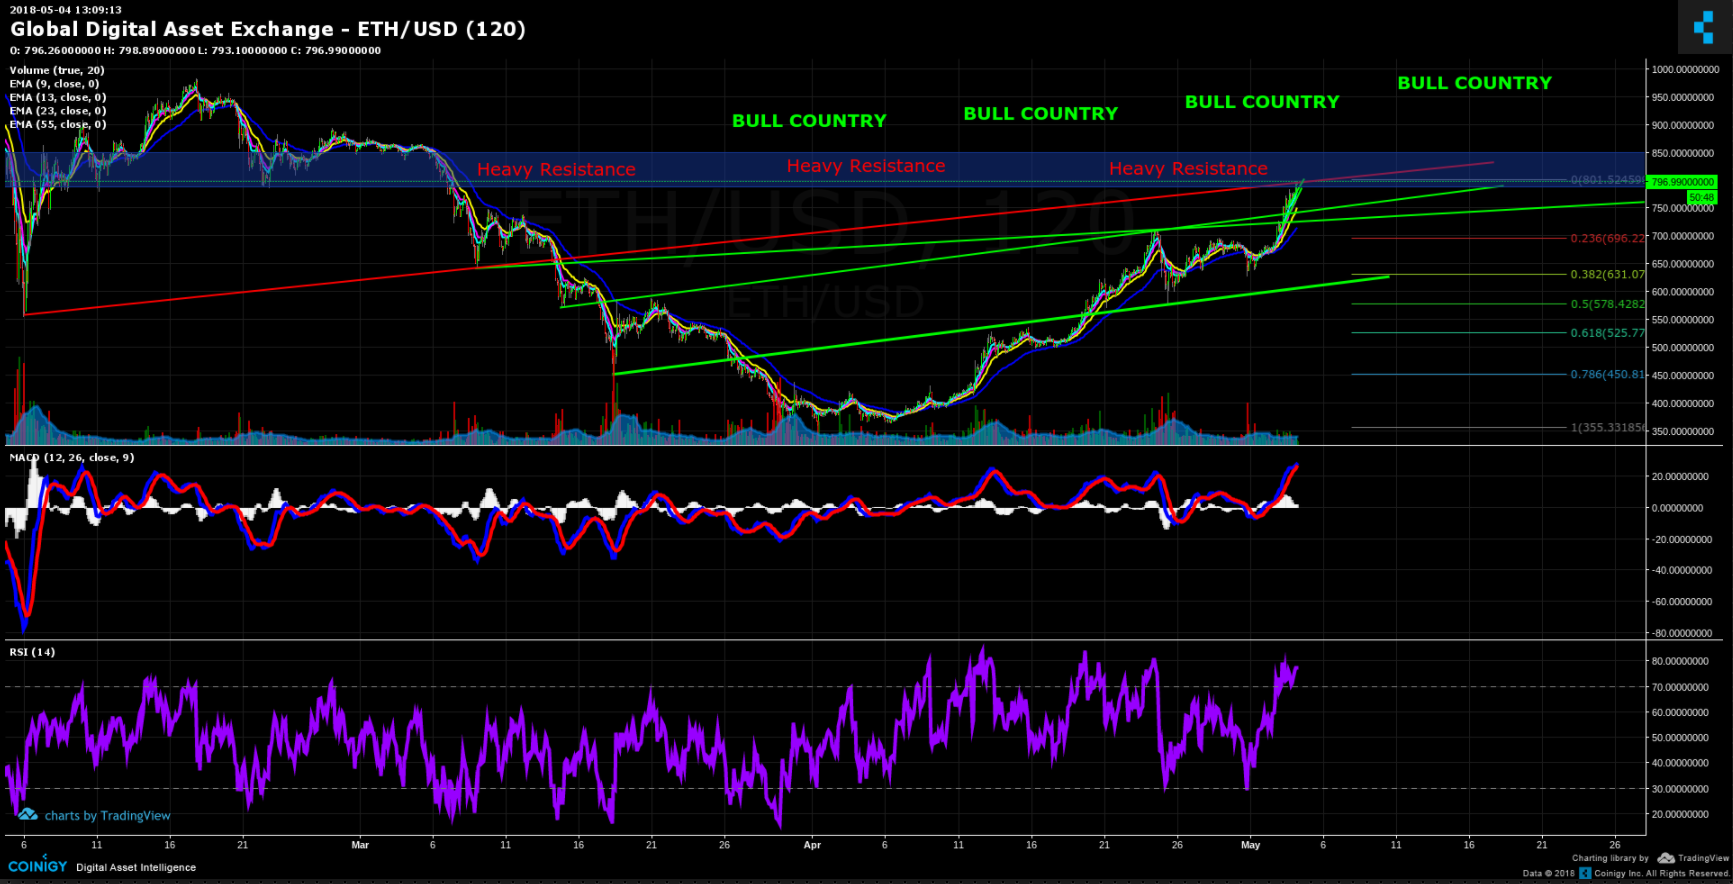
Good Morning/Afternoon/Evening everyone, Today were going to take a look at Ethereum. Of the coinbase big four, it was this week's biggest winner. Similar to Bitcoin it has approached a critical price zone. The Bears last stand may be here in the 800-850$ range. You might remember this zone acting as a resistance in December 2017. When we broke out we ran all the way to our ATH of 1400. Since then, we broke below it and it is a massive support that turned resistance. When we approach a zone like this, it would make sense to see our indicators slowing down. The markets uncertainty.
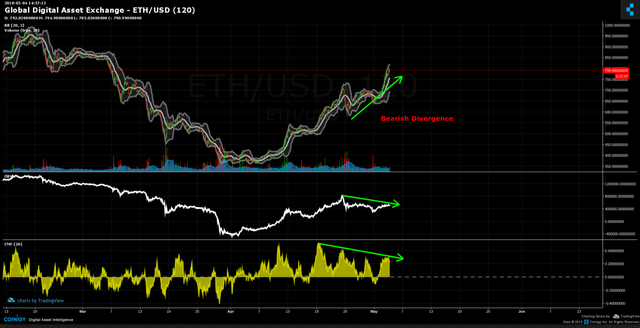
In our MACD we can see our macd line (blue) beginning to cross over our Signal (line). This can indicate a change in trend or the slowing of the current trend. We also can see bearish divergence in our OBV (white indicator). Price continuing upward without the volume to confirm the movement. Our RSI (purple indicator) is showing the same bearish divergence with price going higher and strength going lower. Lastly you can also see bearish divergence in our Chaikin Money flow indicator (yellow). In the next week we will post some educational information on some of these volume indicators if this doesn't quite make sense.
Bulls need to consolidate in this area. If we do correct a bit, we have illustrated with green lines some support zones. Potential buying zones where one could expect to see a bounce. You can also use fib levels as support zones. We have those illustrated on the right.
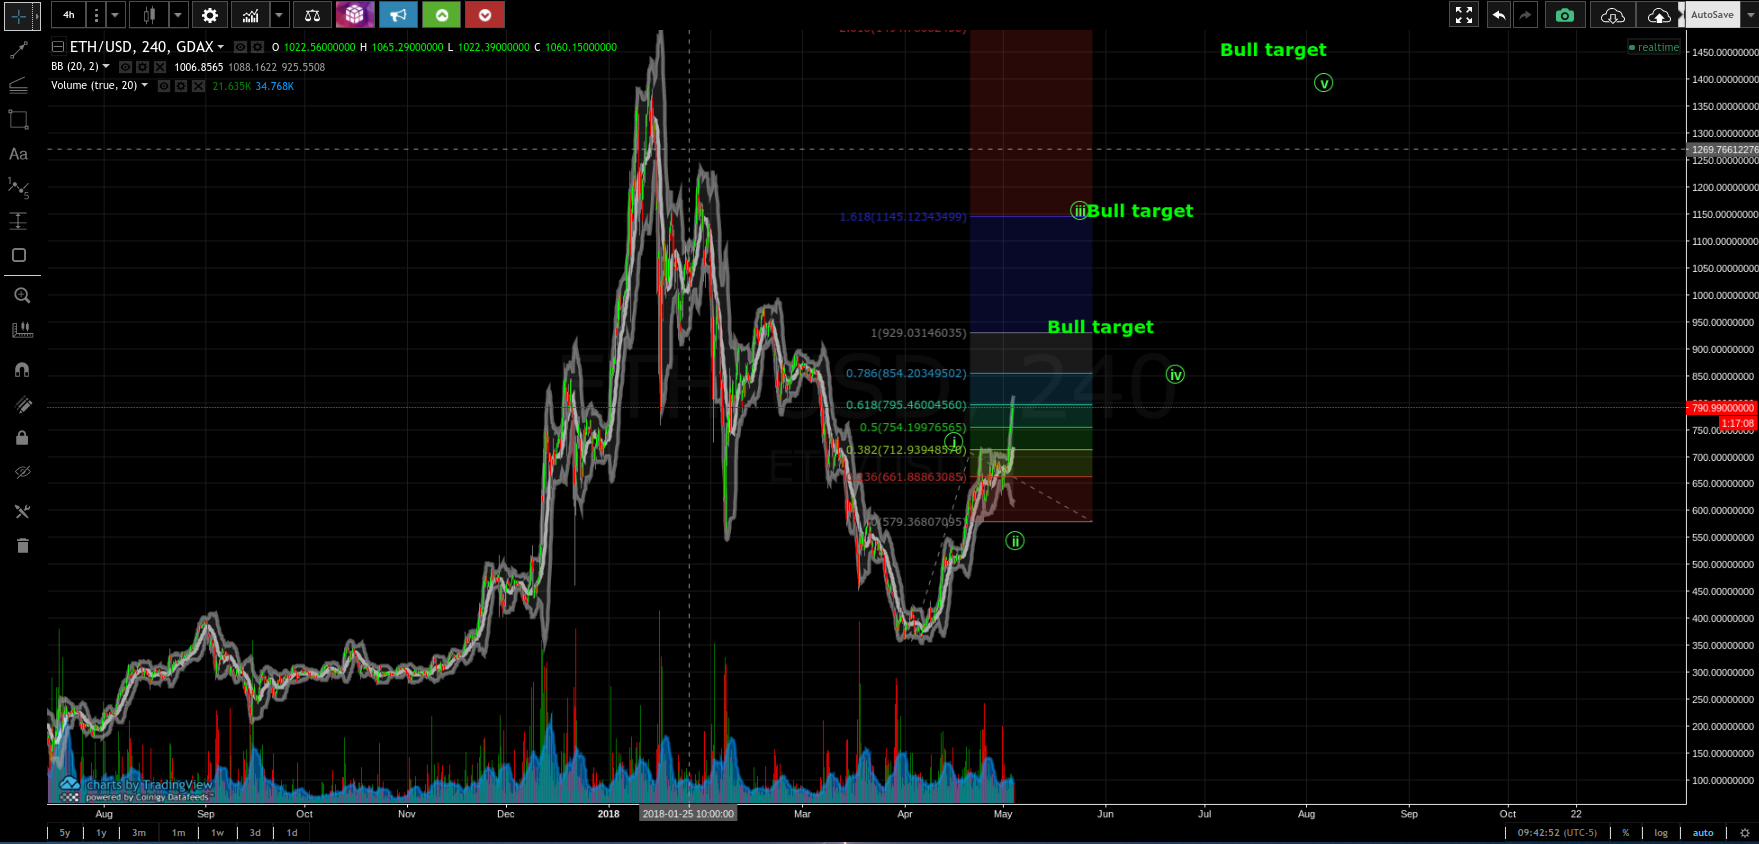
Bullish scenario- we are hoping to break through this level with the needed increasing in buying volume. Using our fib ext tool on the previous wave high of 702 and low of 573 we can target a 1:1 extension of 917$. Target 1.618 ext at 1129$. And a target 2.618 ext at 1465$. This is assuming we are in an elliot wave cycle 3. Wave one ending at 702 and wave two ending at 573. Please keep in mind we are not here for financial advice, continue to do your own research. Be safe and manage your risk!


