Post Correction? Let's Chart It Out... (ETH, EOS, LTC, TRX).
Bounce!
I'm not saying the correction is over yet, but we're seeing far more positive signs at the moment that might suggest it is.
So, let's take a look at some of those good 'ole charts and see what's happening!
Ethereum
Ethereum was a little late to the correction party, so I'm not fully convinced ETH is out of the woods yet, but that's not say it isn't.
ETH fell to a low of around $800 today during the sell off, but has now recovered most of its earlier losses after a brief dip into oversold territory led to a nice bounce:
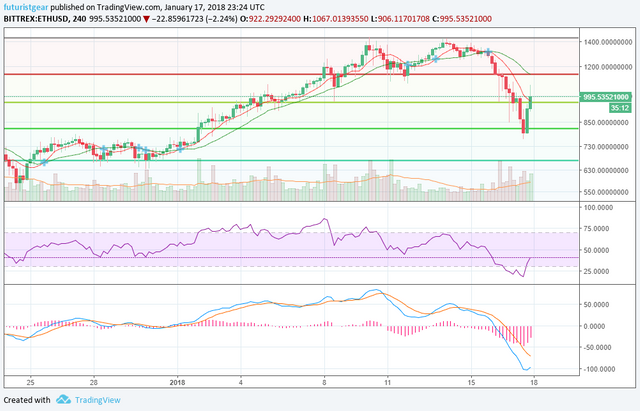
4 Hour Chart
The MACD for Ethereum also looks like it could be heading back towards the bullish reading too, so maybe the correction for ETH is over.
The next key level on my chart is the red Fibonacci line, which also coincides with a support level too.
EOS
EOS damn near gave back all of its recent gains, but held just above the full retracement level, and has also experienced a nice bounce too:
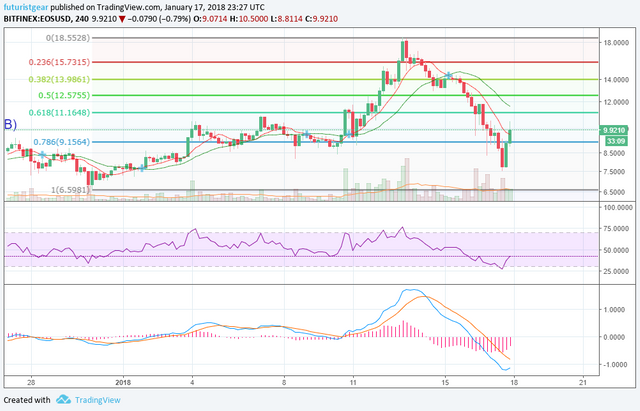
4 Hour Chart
EOS never reached an oversold reading, so this indicated that there should be support at around the $7.50 marker.
The EOS MACD also seems to be heading back to a bullish too, so things are looking up as I post this.
The next key level will be the .618 Fibonacci level, which also looks to be a support/resistance level too.
Litecoin
Litecoin continues to copy Bitcoin, and after dipping as low as $140, it also bounced after showing oversold on my chart:
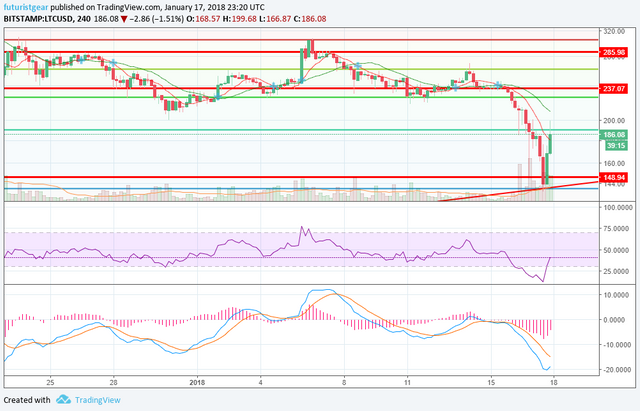
4 Hour Chart
What's also interesting - and also good news - is that the uptrend line (red diagonal down the bottom) also held.
The MACD for LTC also looks like it could be turning back towards a bullish reading here too. But like ETH and EOS, we'll have to wait and see!
Lastly...
Tron (TRX)
I posted about Tron yesterday, when it was trading in a triangle-like pattern against the ETH pairing, and it seems I may have had my line in slightly the wrong place, but it did do what I was hoping for, and has broken out against Ethereum today:
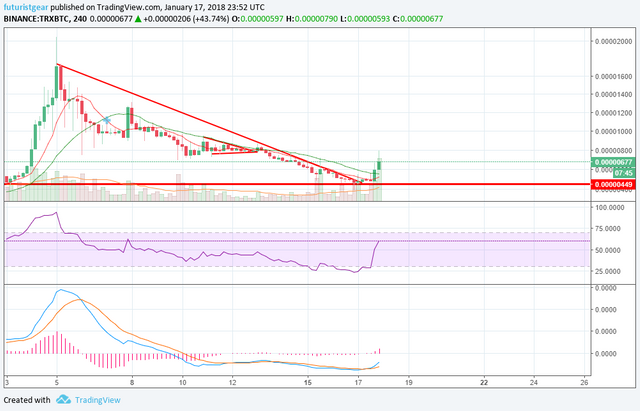
4 Hour Chart
Despite the rally, the MACD is still below the signal line here, but hopefully with the RSI showing at a bullish level above 50, that could soon change!
But Tron is looking pretty strong right now, and showing around a +40% gain at the moment.
How Are You Hodling Up?
Things are looking a lot better now they did earlier that's for sure! Are you HODLing strong? Buying the dip? Or waiting for more bullish confirmation before adding any coins to your stash? Let me know in the comments!
Thanks for viewing!
For more awesome technical analysis and crypto related posts, see also: @toofasteddie, @gazur, @ew-and-patterns, @pawsdog, @cryptomagic, @exxodus, @beiker, @allthereisislove, @lordoftruth, @masterthematrix, @cryptoheads, @tombort, @maarnio & @steemaze
Not investment, financial or trading advice.
I've been sitting, hodlin', waiting out the storm.
Excited to see where the next bounce will lead... 30? 40?......50k?
Nice work Jeff! 30k sounds reasonable, then it'll probably pull back to 20k again. :-D
Seems to go up a nice chunk and then retreat to the previous all time high doesn't it?
I think the $5000 mark was the only time an all time high didn't get re-tested... I need to look into that!
It does seem to go that way
5K was fairly short-lived!
Yep! Up and down between those key numbers like a yoyo. :-)
I can't really remember how long it stayed at $5000 tbh, but I think you're right! It was pretty short lived.
Hopefully I can find some interesting patterns the more I look into it.
Keep us posted!
Will do! :-D