Ethereum Price Decline
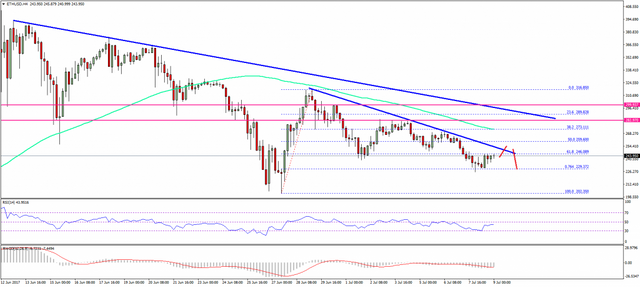
This past week was mostly bearish for ETH price as it moved below $260 against the US Dollar. The top placed at $316.85 ignited a major downside move.
The price is following a major bearish path, and currently trading below the $260 support and the 100 simple moving average (H4). There was also a break below the 50% Fib retracement level of the last wave from the $202.35 low to $316.85 high.
It is a clear sign that there are chances of a complete retest of $202.35 in the near term.
On the upside, there are two major bearish trend lines forming with resistances as $252 and $288 on the 4-hours chart of ETH/USD. The first trend line can be considered as a short-term pivot above $250.
The second one is mainly the bearish trend holder below $300. An intermediate resistance is around the 100 simple moving average (H4) at $273. So, it looks like a recovery won’t be easy for ETH above $280-300 in the near term.
