Huge Ethereum Mixer
68% of total Ethereum transaction value controlled by one system
UPDATE: We have released Jupiter notebook on Github so that anyone can repeat the analysis done.
Analyzing the Ethereum transactions, cyber•Fund has come across a finding that struck us so much that we rushed to dig deeper into this issue. We now wish to share our findings with a community hoping to come up with an explanation together.
What we found

The clusterization of all Ethereum addresses from the inception of Ethereum until 15.09.2017 revealed a class of addresses that we will call in this paper temporary. These are addresses where funds come and leave within a short time interval - no longer than 1 hour, after which the addresses are never used again. The temporary addresses constituted 46% of all active addresses and processed 65% of total transaction value during the analysed period. Analyzing transactions where these addresses were involved, we managed to collect piece by piece a full picture of what was going on:

In the centre of the picture above, one can see a core of the Mixer which consists of more than 95% of temporary addresses. This core interacts with a group of shell addresses, or a shell layer, which includes both permanent and temporary addresses. The shell layer in its turn receives ETH from what we will call input addresses and sends ETH to output addresses displayed left- and right-hand on the scheme respectively. We looked up the names of the owners of these addresses in Etherscan. Only a few of these addresses had a name of the owner attached to them on Etherscan. The other names displayed on the picture above are the names mentioned in users’ commentaries on Etherscan, so we can only assume that they are the real owners of these addresses. In the end, it turned out that the total amount transferred into and out of the core is 4 times higher than the total that entered and left the shell and the core taken together. This made us think of a mixer mechanism (further referred to as Mixer).


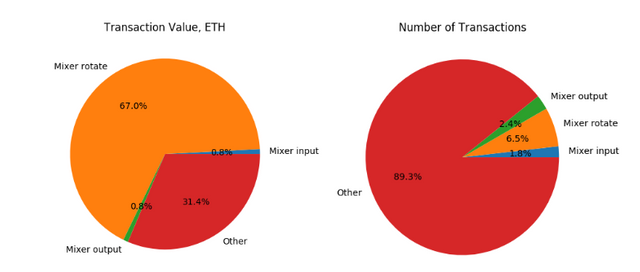
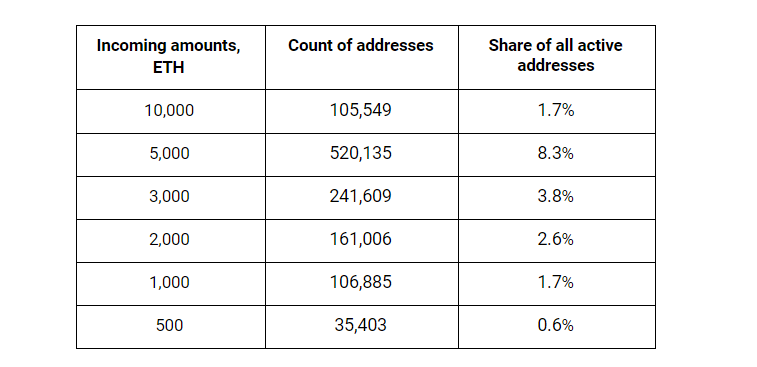
Of all transactions executed on the Ethereum blockchain during the analysed period, addresses with the incoming amounts of ~500, ~1000, ~2000, ~3000, ~5000 and ~10,000 ETH constitute 68.5% (260,1041,693.6 from 3,791,195,132.0 ETH) in money terms and 10.7% (6,216,314 from 58,035,623) in terms of numbers. The further analysis shows that these addresses are linked with each other and might be controlled by a single entity.
This is how the share of the Mixer in all Ethereum transactions has changed over time:


The system seems to be first tested in 2016, and since the start of 2017 it came into active use. This might be explained by the increasing capitalization and liquidity of Ethereum. Most interesting is that an overall growth pattern of Ethereum transactions looks very differently when the Mixer share is excluded. If the Mixer transactions are left out of the analysis, it becomes evident that they contributed to most of the overall Ethereum transaction volume growth.

Analysis that was done

In terms of the incoming transaction volume, these addresses are distributed as follows:
Distribution of Addresses by Transaction Volume

Out of the total of 6,282,858 addresses involved in all transactions executed on the Ethereum blockchain since its inception till 15 September 2017 the following sets of addresses gained our attention:

These addresses account for 67.5% of all transferred ETH and constitute 8.5% of the total number of transactions on Ethereum during the analysed period. So why do we think these addresses are linked?

The graph below displays how these sets of addresses replace each other almost one by one. Take one set of addresses, e.g. addresses with incoming amounts of around 1000 ETH. After being active for some time, this set of addresses becomes inactive and this is when another set steps in, e.g. that with 3000 incoming ETH per transaction. Thus, addresses “act” as if orchestrated following one another over time which makes us think there is a certain system managing these activities. These addresses constitute the core of the scheme.

Findings
Analyzing the system further, we identified temporary and permanent addresses that surround the core and are linked with it. The calculations for the core and the linked addresses for the period starting from the inception of Ethereum until 15.09.2017 bring about the following results:

Hypotheses
These are possible explanations for the detected activities we could come up with:
- The protection offered to clients by crypto-exchanges: all clients’ funds are mixed so that the funds’ sources cannot be tracked and those holding clean money cannot be unjustifiably accused of any illegal activity
- A mechanism set in place to protect U.S. residents who wish to avoid control from U.S. regulatory bodies
- A mechanism used by a large private exchange to preserve the privacy of its clients; this exchange might be operating with fiat money
- A mechanism used to securely transfer crypto-assets between crypto-exchanges
- Any kind of Ether-laundering scheme
These are only hypotheses which we would like to discuss with anyone interested in our findings. If you have any other suggestions or explanations, please do not hesitate to share them with us. You can find more details in the Appendix.
You can always contact us at: [email protected], [email protected]
Appendix
Note: If you wish to look up the addresses below on Etherscan by yourself, use the list in this Google Sheets doc.
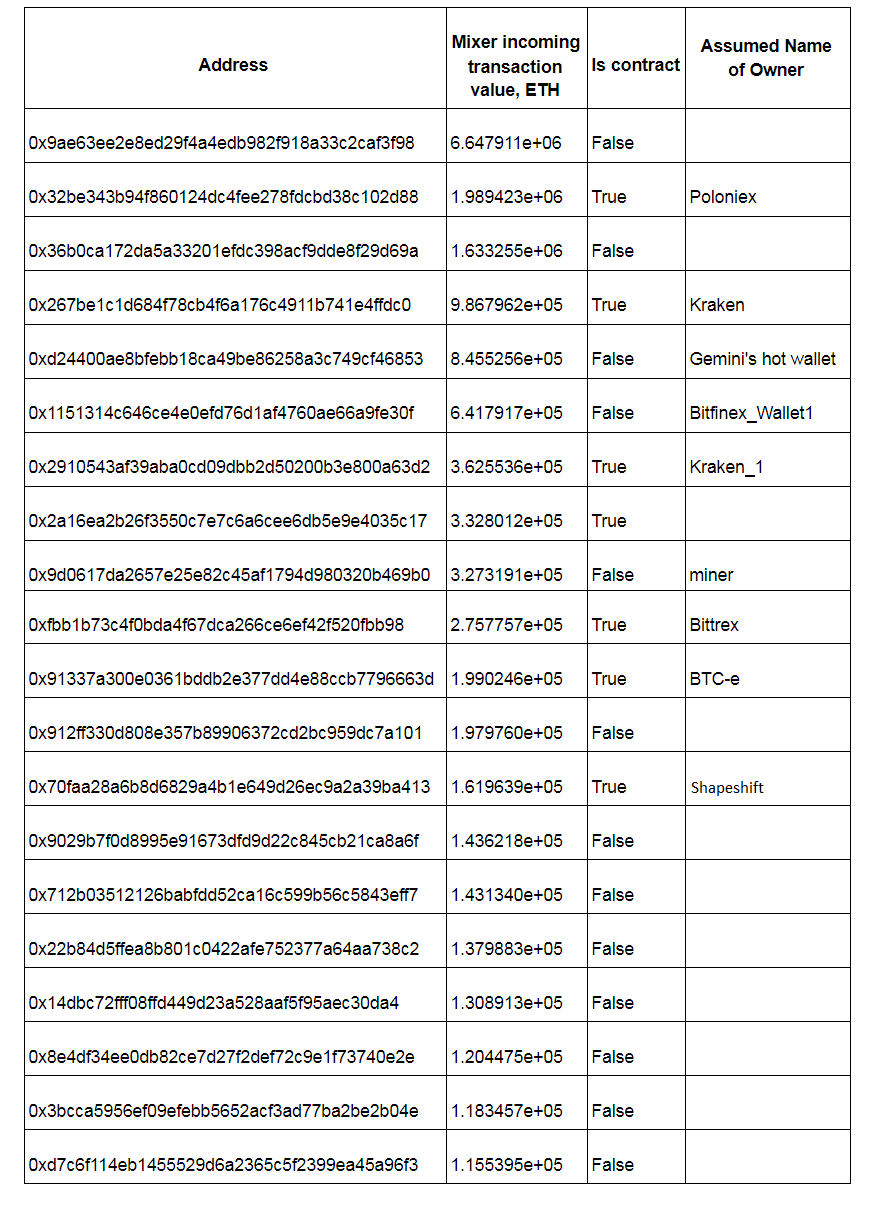
Top 20 input addresses (ETH transferred into the Mixer)

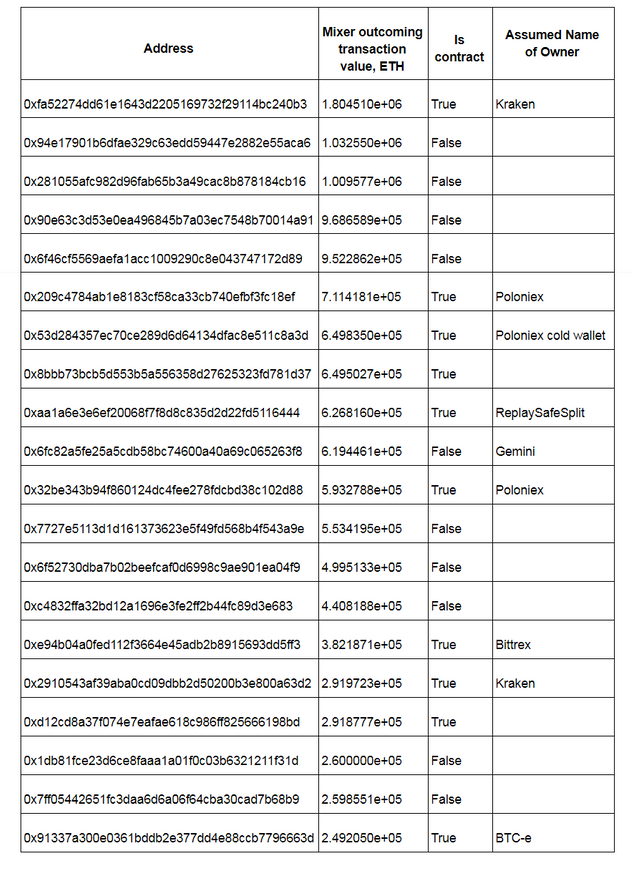
Top 20 output addresses (ETH transferred out of the Mixer)

You can read this article on Medium.

UPDATE: We have released Jupiter notebook on Github so that anyone can repeat the analysis done.
I always wondered if this was similar to how exchanges work, a simple IOU system, then just payouts. I could be wrong, but in Eth we Trust.
"in Eth we Trust" are you ironic? or just average eth folk?
This Mixer might be a part of the infrastructure of one or several exhanges. The question is: which one(s)?
Wow. This is something. I'm confused a bit though. This part:
Are you saying that 68.5% of all ETH (value) is traded by this single "Mixer" entity? And that although the value of these trades is 68.5% of the total ETH value, the trades make up only 10.7% of all trading volume?
Thanks for the clarification!
@brixx Yes, that is correct. We have released our research on Github with some additional charts: https://github.com/cyberFund/DataScience/blob/master/transaction_analysis_huge_ethereum_mixer.ipynb
When I dug into the BitConnect Bitcoin blockchain I saw things that were similar. Since BitConnect is a Ponzi Scheme; and they want to hide that fact they do a great deal of "tumbling" of Bitcoin. Each customers bitcoins was spun out daily to an individual address, and about 5-10 temporary fake (confusion causing) addresses were created for each round of payouts, then they all went back into pot for the next round. This happened constantly, which made tracking it down exceedingly difficult. I also saw similar things on the exchanges. I detail one here. https://steemit.com/ico/@cryptick/how-to-fake-a-top-100-alt-coin-chart
Right now there are big number of 2-3 ETH deposits done at Binance, which caught my attention. They look very suspicious, so I started digging - ALL of them are linked to few MASTER accounts with 20-30+ K ETH...those MASTER accounts are splitting the funds, in to smaller batches/addresses which in turn do the same .... we are talking for thousands of intermediary accounts - 1 sending to another and so on until eventually all goes to Binance in small transfers of 2-3 ETH from many, many accounts (may be same thing is happening with other exchanges, I just noticed that in Binance)
Looks like someone is trying to hide/mask the big amounts, or simply making more difficult to trace "source" of the main funds.... No idea why would anyone want to do that, but I remembered about your post I read few month ago and decided to share what I discovered today as it is very much similar to your discovery.