ANALYSIS COURSE ETHEREUM CLASSIC 08.08.2016

Price Ethereum Classic decreased and closed below 0.0040 BTC. Possibly, there may be greater losses in the pair ETC / BTC.
Key points
Price Ethereum Classic is continuing to decline, and the early assumption that investing in ETC desirable, proved to be correct.
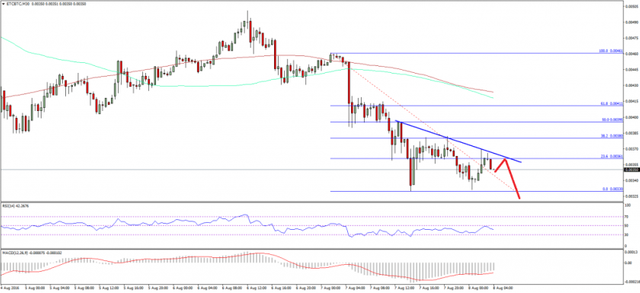
Appears a new bearish trend line formed a 30-minute chart ETC / BTC (Simplefx data), which acts as a resistance during the return movement.
A break below the recent low 0.0033 BTC can contribute to large losses in the short term.
Price reduction Ethereum Classic
Price Ethereum Classic ETC price suddenly began to trade lower. New week low was formed at a level lower than 0.0040 BTC, as the pair ETC / BTC conducts trade as low as 0.0033 BTC. Price twice tried to break through the declared level, but failed, and then started to move upwards.
However, the growth potential may be limited because there is a new bearish trend line formed on the 30-minute chart ETC / BTC (Simplefx data). Dedicated trend line now acts as resistance and prevents growth. In addition, the 23.6% Fib from 0.0046 BTC to 0.0033 BTC also acts as a barrier to the bulls and stops moving up. As long as the price is below the trend line resistance, there is a risk of further reduction.
Technical Analysis Prices Ethereum Classic
Only a break above the trend line could negate the situation and cause the price recovery ETC. In this situation, the price may trade in the direction of 50% Fib from 0.0046 BTC to 0.0033 BTC.

30 minute MACD - MACD indicator is in bearish zone, which is a negative sign for the bulls.
The 30-minute RSI - RSI indicator is also below the level of 50, which is a bearish sign.
The main support level - 0.0033 BTC
The main resistance level - 0.0038 BTC