Ethereum Technical Analysis : $160 support broken, further decline to $135 once price close below $154 S2 support
Hey folks,
I hope you guys made enough profits by the trading signal :)
As I have posted about major decline is going to happen from $188 to $160 [ ETH/USD pair ] on my telegram channel yesterday : Crypto Trading Technical Analysis, since price broke the major support level.
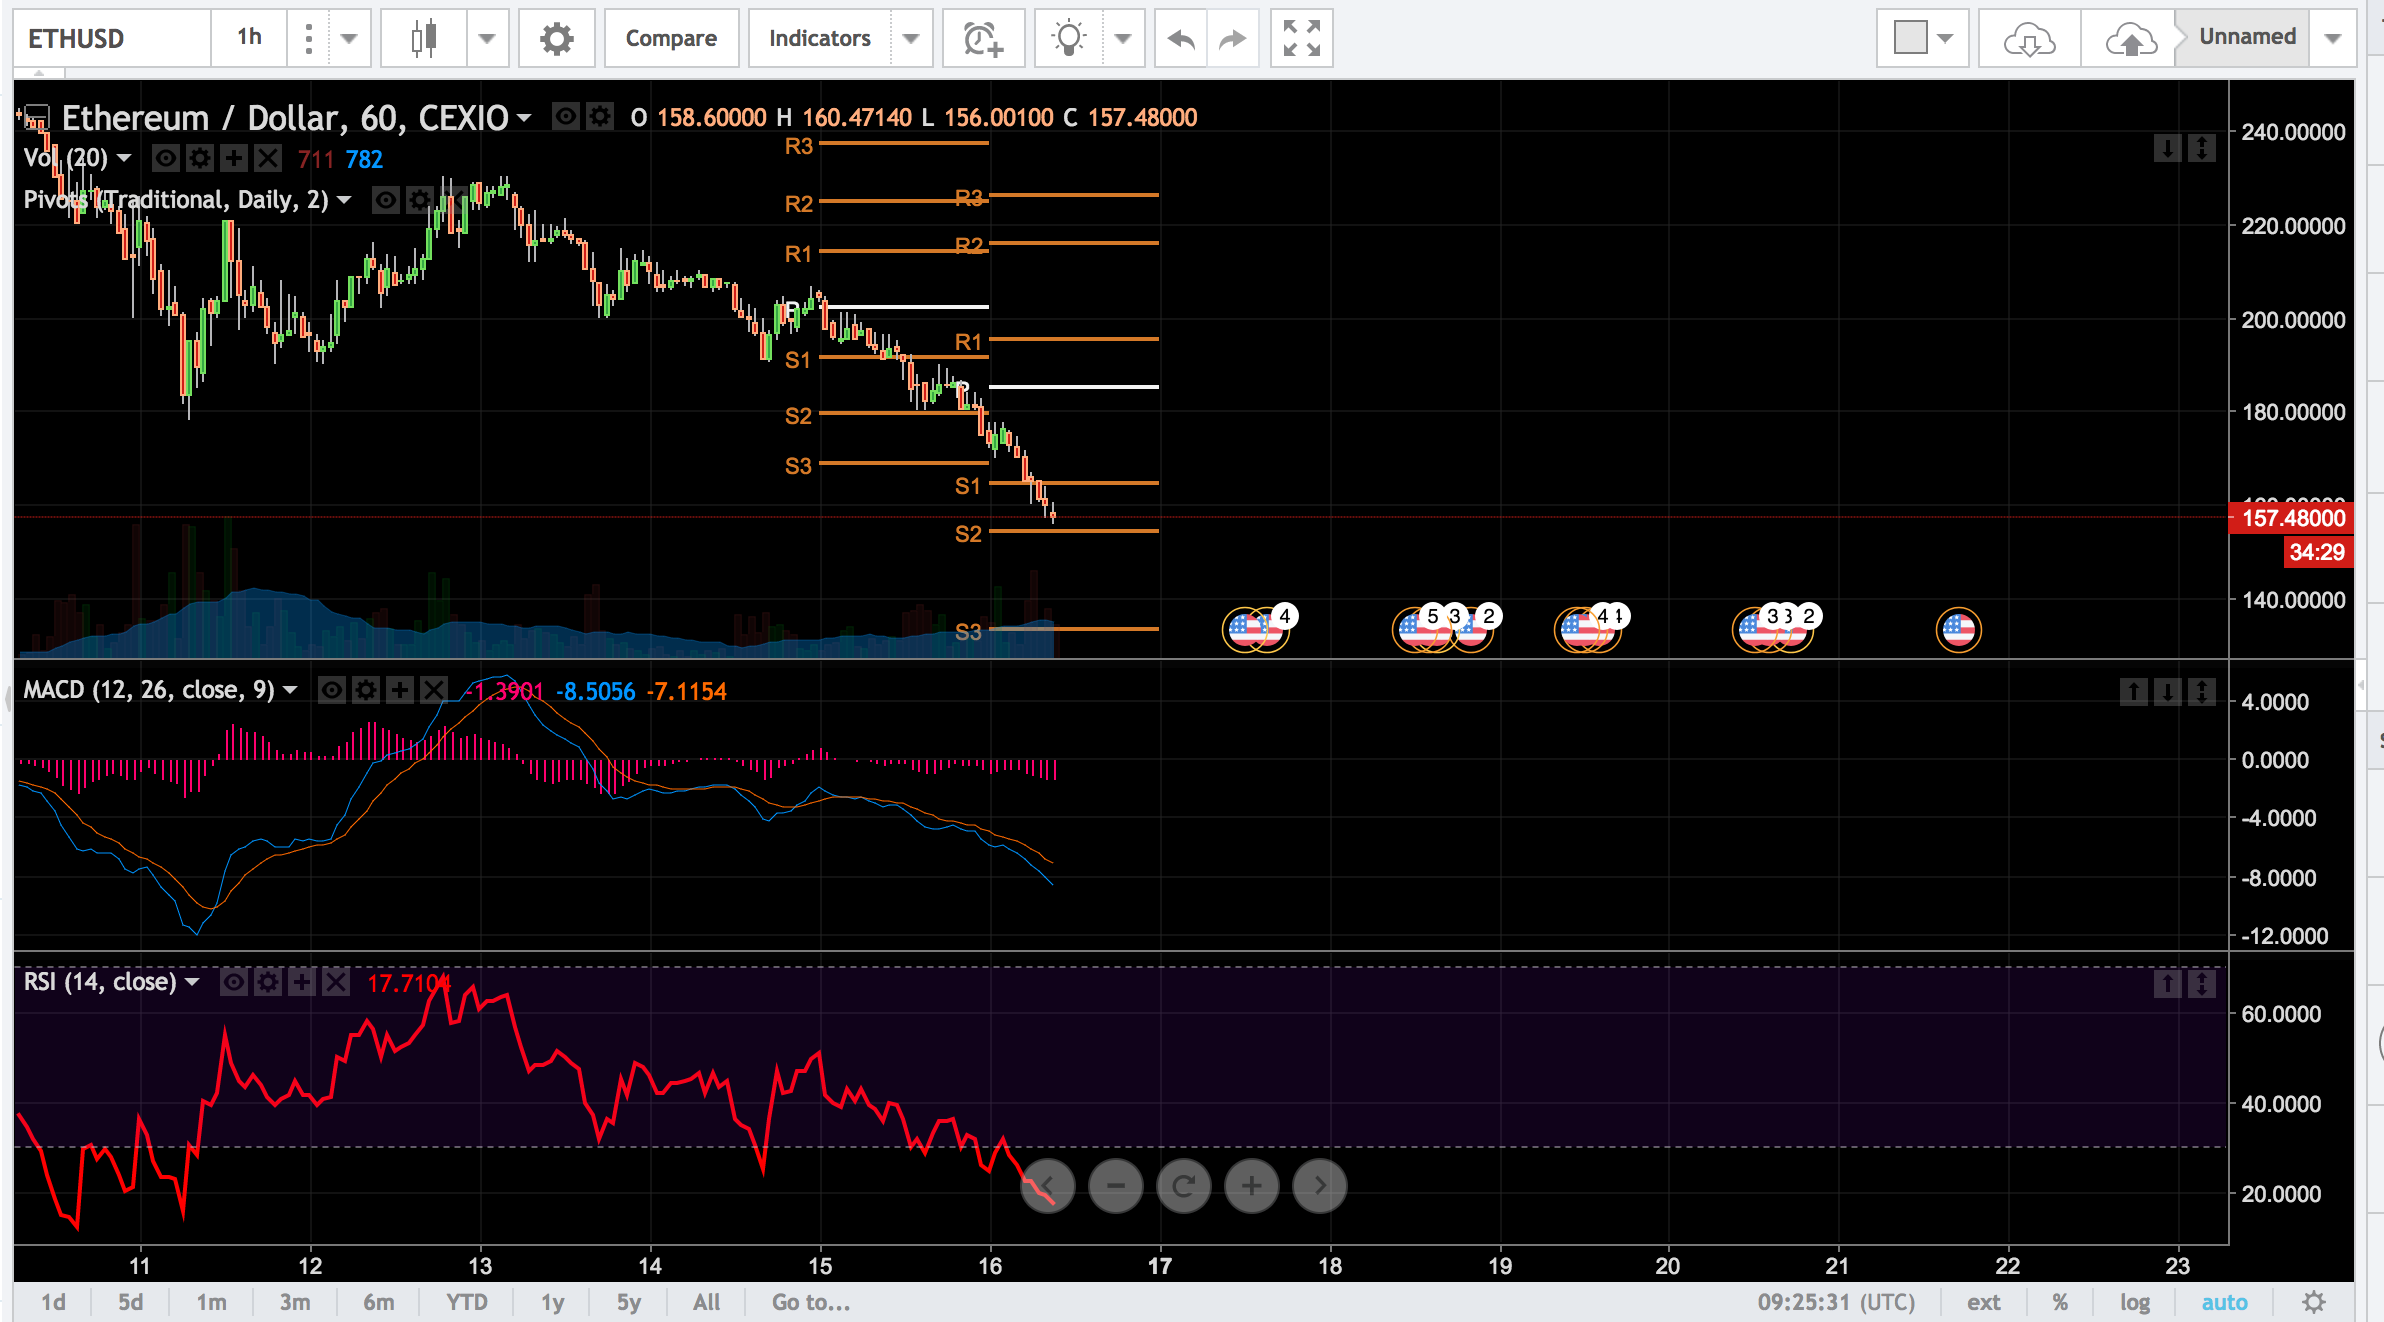
Further decline is bound to happen when price close below $154 S2 support of pivot band.
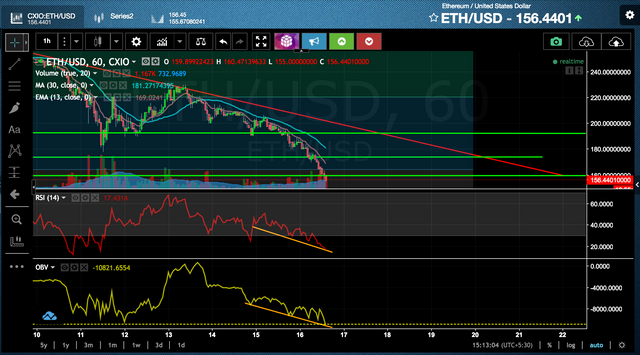
1-hour price chart with pivot band:
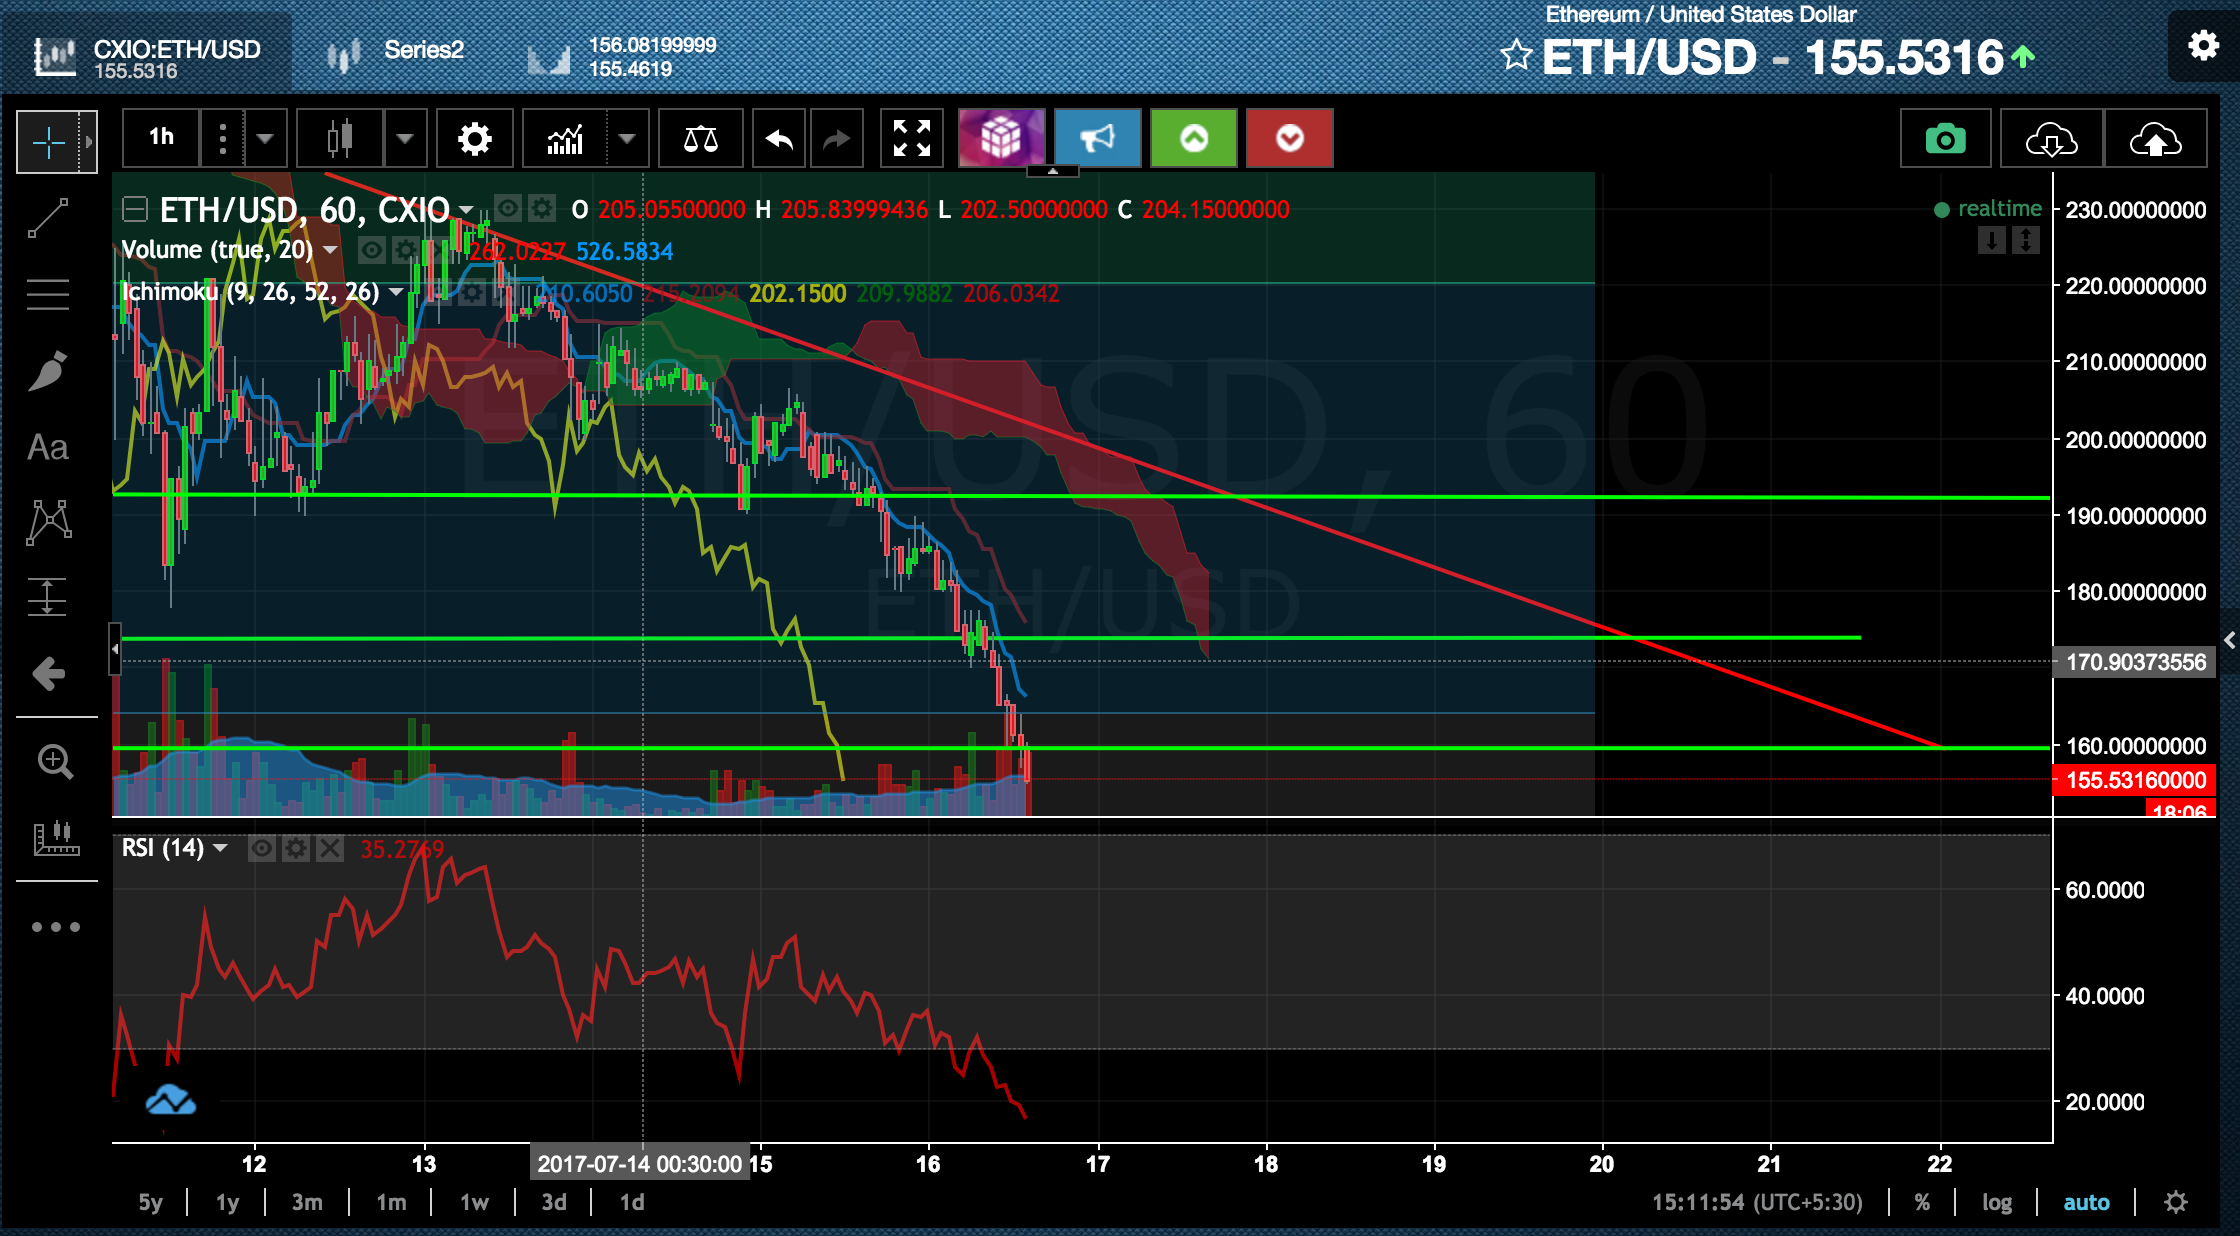
4-hour price chart with pivot band:

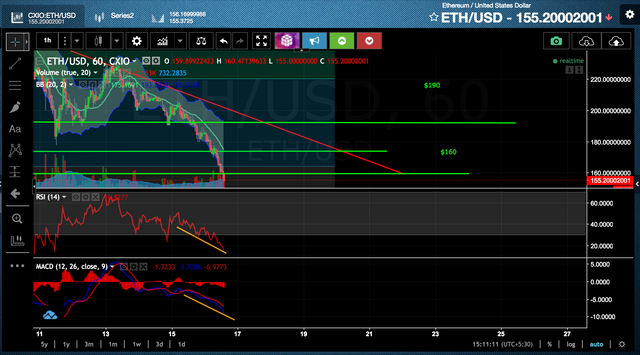
Trendline: Support and Resistances
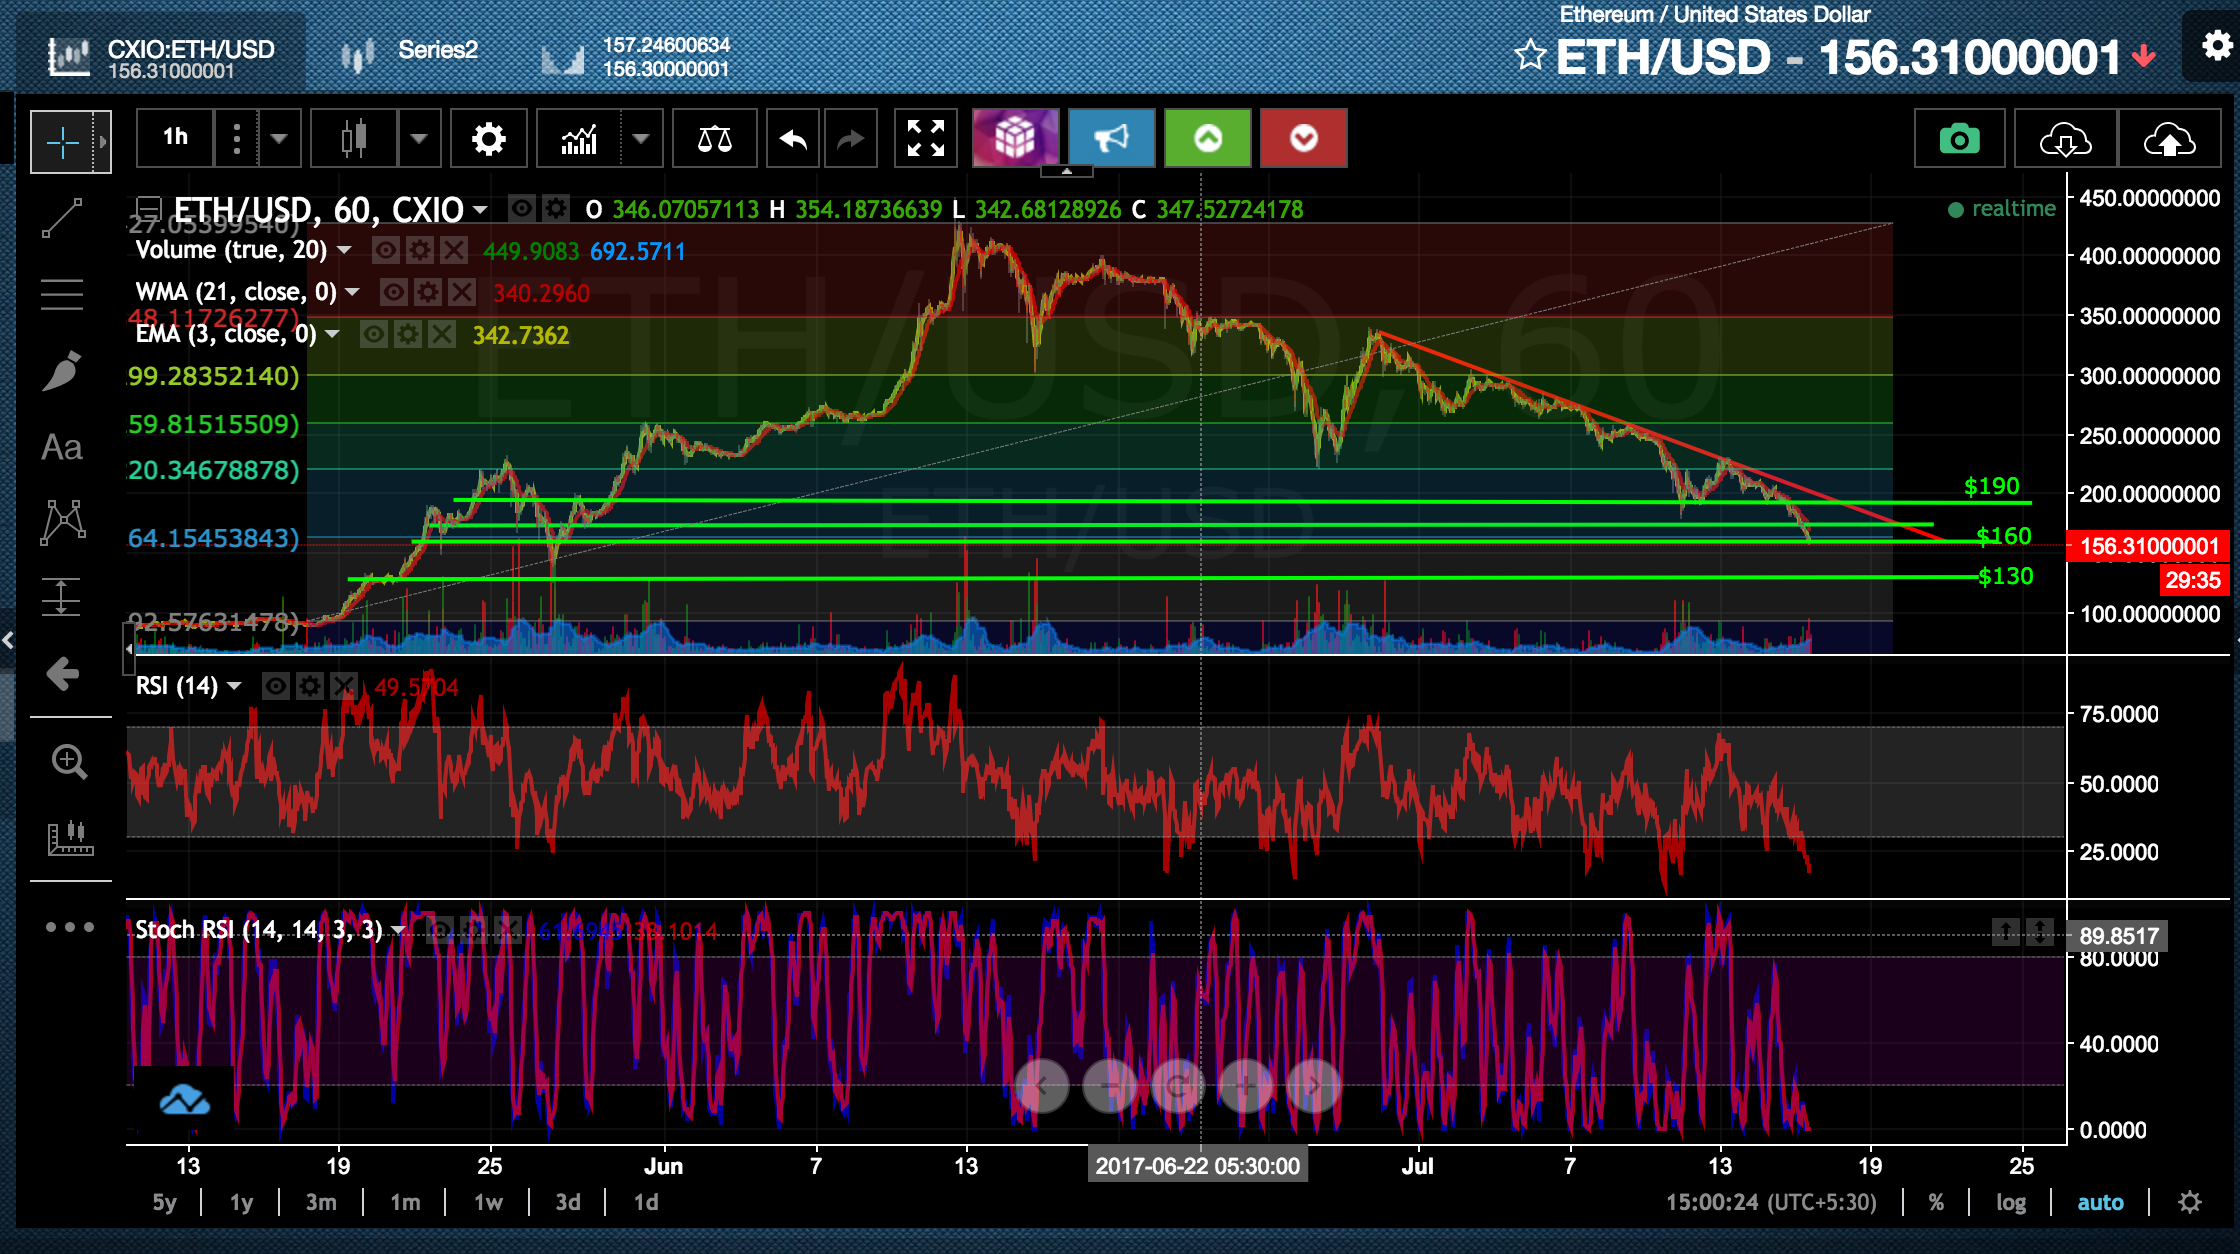
Keep an eye on RSI & stochastic RSI as RSI is in oversold region, it will rebound a bit to make further downward movement as MACD is strongly bearish.
Ichimoku also signaling strong bearish ETH/USD market:
Volume Analysis: Also indicating further losses as no Volume divergence found with respect to Price
 **
**
Must Read : Don't Panic: soft fork or hard fork is good for Bitcoin !!
UpVote if you find it helpful, Resteemit to spread the words, Follow Me for more updates and cryptocurrency technical analysis.
Join My Channel at Telegram : Crypto Trading Technical Analysis
very usefull....upvote and follow you
It looks like the pendulum may swing back to April prices.
informative..thanks
followed you.
hey try this :) https://kr.tradingview.com/script/q8X3VpaO/
tell me your tradinview id, and then you can use it
aqfaridi