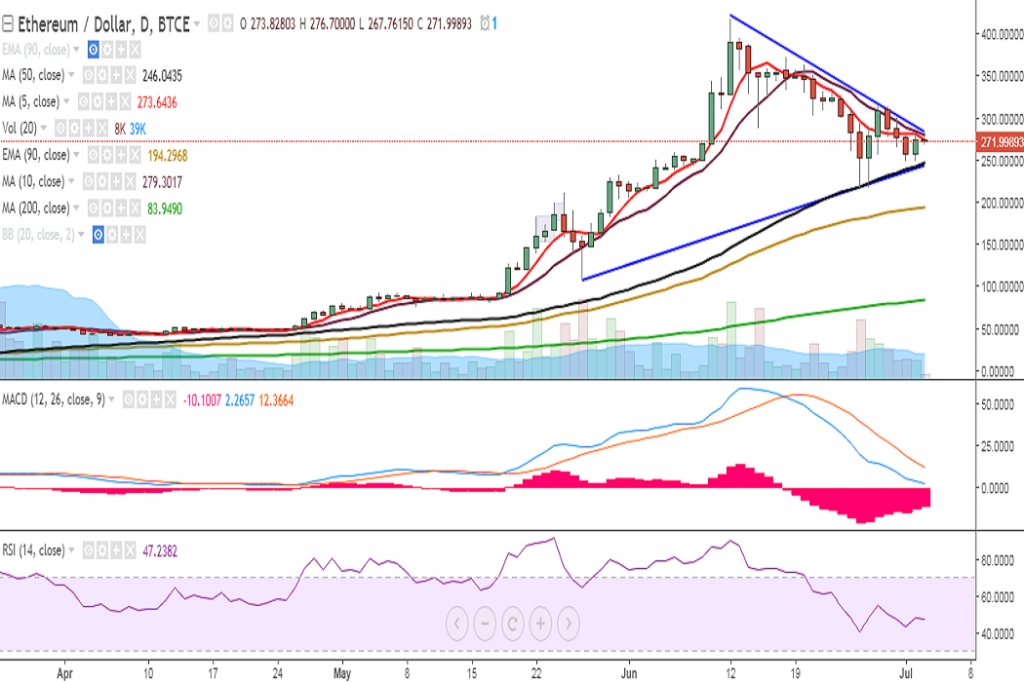
ETH/USD holds 50-DMA support, decisive break above trend line resistance to see further upside

TH/USD is continuing its rangebound trading on Monday as it continues in a symmetrical triangle pattern. It is currently trading at 272 levels at the time of writing (BTC-e).
Ichimoku analysis (Daily chart):
Tenkan-Sen: 265.76
Kijun-Sen: 316.75
The pair’s upside is currently being capped by 281 (trend line joining 417 and 315) and a consistent break above would see it testing 322 (20-DMA)/ 340 (61.8% retracement of 417 and 216.51). Further strength would target 371 (June 18 high)/417 (June 12 high).
On the downside, support is seen at 263 (1h 50-SMA) and any violation would drag it to 246 (convergence of 50-DMA and trend line joining 107.06 and 216.51)/225 (61.8% retracement of 107.06 and 417). Further weakness would see it testing 194 (90-EMA).
Momentum studies: On the daily chart, MACD line is below the signal line, and RSI is weak at 47.
On the 1-hour chart, the pair is struggling for a consistent break above 272 (Cloud top) and further bullishness would be confirmed only if it breaches trend line resistance.
On the weekly chart, the pair is trading well below 5-SMA and stochs appear to have rolled over from the overbought zone. However, RSI is holding above 70 and MACD line is above the signal line. Further bearishness in the pair would be confirmed only if it breaks below 50-DMA.
Recommendation: Wait for clear directional bias.
Thanks for the good article